ก่อนอ่านบทความนี้Before you read
บทความนี้อยู่ในระดับเจาะลึก ควรเข้าใจเรื่องความถี่และความยาวคลื่น ย่านออกเตฟ การวิเคราะห์ FFT และบทความความเข้มเสียงกับการหาทิศทางของเสียงก่อน เนื้อหาเป็นกลางไม่อิงยี่ห้อ อธิบายหลักการที่ใช้ร่วมกันในเครื่องมือประเภทนี้ เพื่อให้เลือกวิธีและอ่านผลได้ถูกต้องThis is an advanced article. It helps to understand frequency and wavelength, octave bands, FFT analysis and the article on sound intensity and direction of arrival first. The content is vendor-neutral: it explains principles shared by this class of tools so you can choose a method and read results correctly.
ทำไมต้องมี “ภาพ” ของเสียงWhy a “picture” of sound helps
เครื่องวัดระดับเสียงบอกว่าดังเท่าไร แต่ไม่ได้บอกว่าเสียงออกมาจากส่วนไหนของเครื่องจักร ถ้าเครื่องอัดอากาศมีมอเตอร์ พัดลม ท่อ และวาล์ว เราต้องรู้ว่าส่วนไหนเป็นตัวหลักก่อนจะลงทุนแก้ไข หรือถ้าห้องประชุมได้ยินเสียงจากห้องข้าง ๆ เราต้องรู้ว่าเสียงรั่วผ่านผนัง ประตู ช่องท่อ หรือฝ้า ภาพที่แสดงตำแหน่งเสียงช่วยให้ทุกฝ่ายเห็นปัญหาเดียวกันได้เร็วA sound level meter says how loud, but not which part of a machine the sound comes from. If a compressor has a motor, a fan, pipes and valves, we need to know which part dominates before investing in a fix. If a meeting room hears the room next door, we need to know whether sound leaks through the wall, the door, a duct opening or the ceiling. A picture showing where the sound comes from lets everyone see the same problem quickly.
หลักการ Delay-and-sum แบบเข้าใจง่ายDelay-and-sum in plain terms
ลองนึกถึงคนหลายคนยืนเรียงแถว แต่ละคนถือนาฬิกาจับเวลาที่เดินตรงกัน เมื่อมีเสียงปรบมือจากจุดหนึ่ง เสียงไปถึงแต่ละคนไม่พร้อมกัน คนที่ใกล้ได้ยินก่อน คนที่ไกลได้ยินทีหลัง ถ้าเรารู้ตำแหน่งของทุกคน และสมมุติว่าเสียงมาจากจุด A เราคำนวณได้ว่าเสียงจาก A จะถึงแต่ละคนเวลาเท่าไรPicture several people standing in a row, each with a synchronised stopwatch. When someone claps at one spot, the sound reaches each person at a different time: the nearer hear it first, the further later. If we know where everyone stands and assume the sound came from point A, we can calculate when sound from A would reach each person.
Beamforming ทำแบบเดียวกันกับไมโครโฟน: หน่วงเวลา (Delay) สัญญาณของไมโครโฟนแต่ละตัวให้เสียงจากจุด A มาตรงกัน แล้ว รวม (Sum) ถ้ามีเสียงจาก A จริง สัญญาณจะเสริมกันและได้ระดับสูง ถ้าเสียงมาจากที่อื่น สัญญาณจะไม่ตรงกันและหักล้างกันบางส่วน ระดับที่ได้จะต่ำ จากนั้นทำซ้ำกับทุกจุดบนตารางที่ครอบภาพ แล้วนำระดับของแต่ละจุดมาระบายสี ได้เป็นแผนที่เสียงซ้อนบนภาพกล้องBeamforming does the same with microphones: delay each microphone’s signal so that sound from point A lines up, then sum them. If there really is sound from A, the signals reinforce and the level is high; if the sound comes from elsewhere, the signals do not line up and partly cancel, so the level is low. Repeat this for every point on a grid covering the picture, colour each point by its level, and you get a sound map over the camera image.
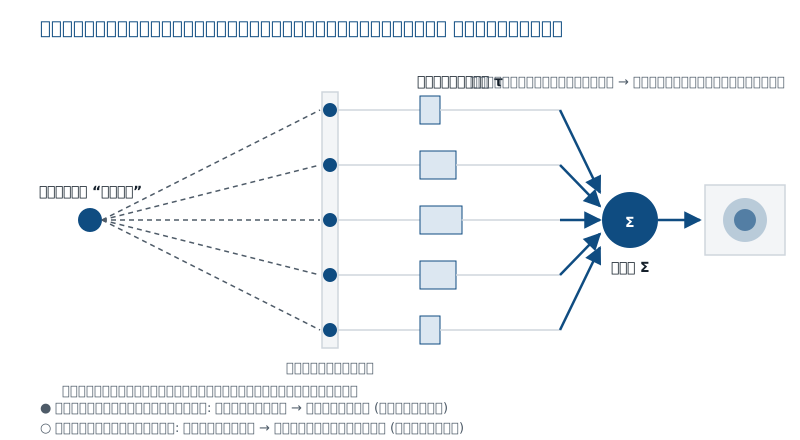
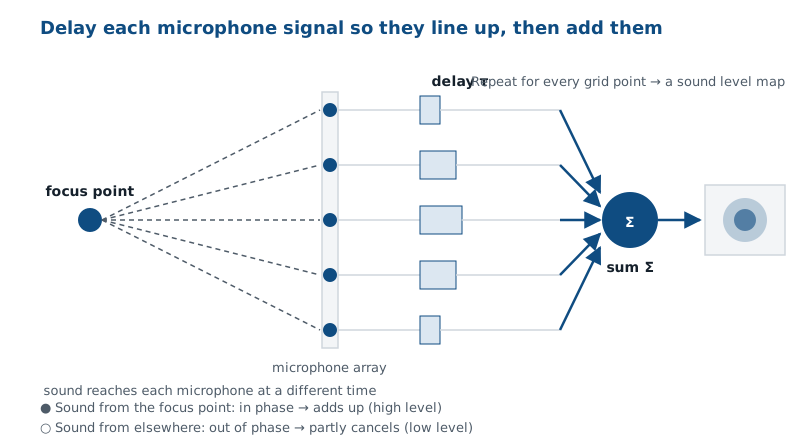
ในทางปฏิบัติ การคำนวณมักทำในโดเมนความถี่ โดยใช้ความสัมพันธ์ของสัญญาณระหว่างไมโครโฟนทุกคู่ (Cross-spectral matrix) แทนการหน่วงเวลาทีละตัวอย่าง และผู้ใช้เลือกย่านความถี่ที่จะแสดง เพราะแหล่งเสียงต่างกันเด่นในความถี่ต่างกัน แผนที่ของย่าน 500 Hz กับย่าน 4 kHz ของเครื่องเดียวกันจึงอาจชี้คนละจุดIn practice the calculation is usually done in the frequency domain, using the relationship between the signals of every microphone pair (the cross-spectral matrix) rather than delaying sample by sample, and the user chooses the frequency band to display. Because different sources dominate different frequencies, the 500 Hz map and the 4 kHz map of the same machine may point to different places.
ขนาดแผง ความถี่ และความละเอียดของภาพArray size, frequency and spatial resolution
แหล่งเสียงที่เป็นจุดเดียวไม่ได้ปรากฏเป็นจุดเล็ก ๆ บนแผนที่ แต่เป็นวงกว้างระดับหนึ่ง เรียกว่า Main lobe ความกว้างของวงนี้คือความละเอียดของภาพ ถ้าสองแหล่งอยู่ใกล้กันกว่าความกว้างนี้ แผนที่จะเห็นเป็นก้อนเดียว สำหรับแผงที่มีขนาด D วัดที่ระยะ z ความกว้างโดยประมาณคือ
R ≈ 1.22 · λ · z / D โดย λ = c / f คือความยาวคลื่น
สูตรนี้เป็นค่าประมาณคร่าว ๆ แบบการเลี้ยวเบน (แนวเกณฑ์ Rayleigh) สำหรับช่องรับรูปวงกลมในอุดมคติที่วัดในระยะไกลพอ ใช้เพื่อเข้าใจแนวโน้ม ไม่ใช่สเปกหรือการทำนายผลของเครื่องรุ่นใด ความละเอียดจริงขึ้นกับรูปทรงแผง การจัดวางไมโครโฟน ระยะวัด ความถี่ อัลกอริทึมบีมฟอร์มมิง การถ่วงน้ำหนักของแผง ช่วงไดนามิก เกณฑ์ที่ใช้ตัดสินว่าแยกแหล่งเสียงได้ และสภาพการวัดจริงA single point source does not appear as a tiny dot on the map but as a patch of a certain width, the main lobe. That width is the spatial resolution: if two sources are closer together than this, the map shows them as one blob. For an array of size D measuring at distance z, the approximate width is
R ≈ 1.22 · λ · z / D, where λ = c / f is the wavelength.
This is a rough diffraction (Rayleigh-style) estimate for an idealized circular aperture at a sufficient distance, used to understand the trend, not the specification or a performance prediction of any instrument. Actual resolution depends on the array geometry, microphone layout, measuring distance, frequency, beamforming algorithm, array weighting, dynamic range, the criterion used to call two sources separated, and the real measurement conditions.
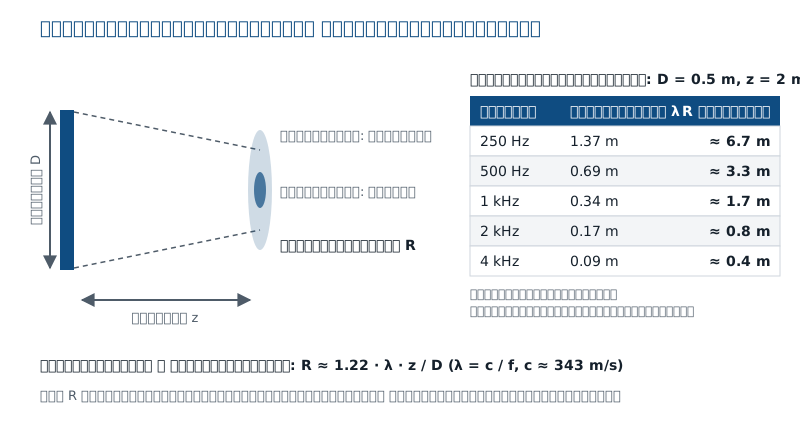
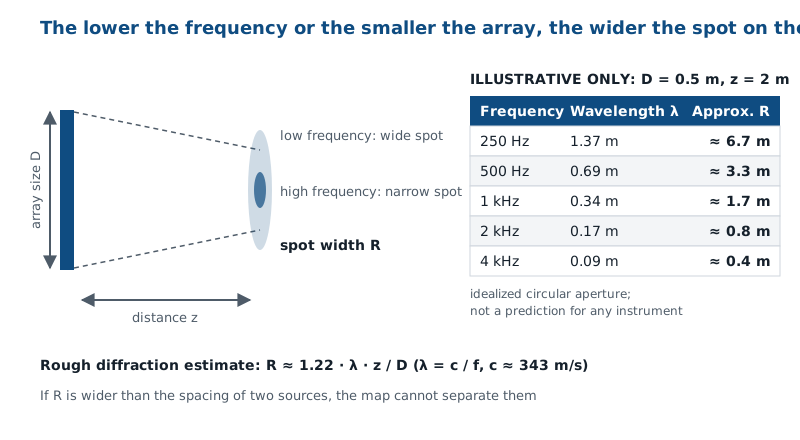
- ความถี่ต่ำต้องใช้แผงใหญ่: ตัวอย่างในภาพแสดงว่าแผงขนาดครึ่งเมตรแทบแยกแหล่งเสียงบนเครื่องจักรขนาดทั่วไปที่ 250 Hz ไม่ได้ ถ้าต้องการดูความถี่ต่ำ ต้องใช้แผงที่ใหญ่ขึ้น เข้าใกล้ขึ้น หรือใช้วิธีอื่นLow frequencies need a large array: the example shows a half-metre array can hardly separate sources on an ordinary-sized machine at 250 Hz. For low frequencies use a larger array, move closer, or use another method.
- ความถี่สูงต้องมีไมโครโฟนถี่พอ: ถ้าระยะห่างระหว่างไมโครโฟนมากเมื่อเทียบกับความยาวคลื่น จะเกิดภาพซ้ำหลอก (Grating lobes / Spatial aliasing) โดยเฉพาะในแผงที่จัดไมโครโฟนเป็นตารางสม่ำเสมอ แผงหลายแบบจึงจัดไมโครโฟนไม่สม่ำเสมอ เช่น แบบเกลียว เพื่อกระจายผลนี้ให้เป็น Side lobe ที่ต่ำลงHigh frequencies need dense microphones: if the microphone spacing is large relative to the wavelength, repeated false images appear (grating lobes / spatial aliasing), especially with a regular grid. Many arrays therefore use an irregular layout, such as a spiral, to spread this effect into lower side lobes.
- เข้าใกล้ช่วยได้ แต่มีราคา: ระยะ z น้อยลงทำให้จุดแคบลง แต่แผงจะเห็นพื้นที่น้อยลง และต้องใช้การคำนวณแบบระยะใกล้ (Near-field focusing)Moving closer helps, at a cost: a smaller z narrows the spot, but the array sees a smaller area and must use near-field focusing in the calculation.
ช่วงไดนามิกของแผนที่และภาพหลอกMap dynamic range and false images
นอกจาก Main lobe แล้ว Beamforming ยังให้ Side lobe คือระดับเทียมรอบ ๆ แหล่งเสียงจริง ซึ่งต่ำกว่า Main lobe ในระดับหนึ่งตามรูปแบบของแผงและความถี่ ถ้ามีแหล่งเสียงที่เบากว่าแหล่งหลักมาก เสียงของมันอาจจมอยู่ใต้ Side lobe ของแหล่งหลัก ช่วงที่แผนที่แยกแหล่งเสียงดังกับแหล่งเสียงเบาได้จริงจึงจำกัด เรียกว่า ช่วงไดนามิกของแผนที่ (Map dynamic range)Besides the main lobe, beamforming produces side lobes: artificial levels around a real source, lower than the main lobe by an amount that depends on the array layout and the frequency. If a secondary source is much quieter than the main one, it can be buried under the main source’s side lobes. The range over which the map can genuinely separate a loud source from a quiet one is therefore limited; this is the map dynamic range.
- สเกลสีเป็นระดับสัมพัทธ์: ซอฟต์แวร์มักแสดงเฉพาะช่วงบนสุดไม่กี่ dB จากค่าสูงสุด การเปลี่ยนช่วงที่แสดงทำให้ภาพดูต่างกันมาก ต้องระบุช่วงที่ใช้ทุกครั้งในรายงานThe colour scale is relative: software usually shows only the top few dB below the maximum. Changing the displayed range changes the picture dramatically, so always state the range in the report.
- ระดับบนแผนที่ไม่ใช่กำลังเสียง: ค่าที่แสดงคือผลของการเล็งที่ตำแหน่งนั้น ขึ้นกับรูปแบบแผงและวิธีคำนวณ ใช้เทียบตำแหน่งและลำดับความสำคัญ ไม่ใช่ใช้แทนการวัดกำลังเสียงตามมาตรฐานMap levels are not sound power: the value shown is the result of focusing at that position and depends on the array and algorithm. Use it to compare positions and priorities, not as a substitute for a standardised sound power measurement.
- วิธีคำนวณขั้นสูง: มีวิธีที่พยายามหักผลของรูปแบบแผงออกจากแผนที่ (Deconvolution) เช่น DAMAS ที่ NASA พัฒนา ทำให้แผนที่คมขึ้นและช่วงไดนามิกกว้างขึ้น แต่มีสมมุติฐานของตัวเอง เช่น แหล่งเสียงแต่ละแหล่งไม่สัมพันธ์กันAdvanced algorithms: some methods try to remove the array’s own pattern from the map (deconvolution), such as DAMAS developed at NASA, giving sharper maps and a wider dynamic range, but they carry their own assumptions, such as the sources being mutually uncorrelated.
โฮโลกราฟีระยะใกล้ (NAH)Near-field acoustic holography (NAH)
โฮโลกราฟีระยะใกล้ (Near-field acoustic holography, NAH) เป็นอีกแนวทางหนึ่ง แผงไมโครโฟนวางใกล้พื้นผิวที่สั่นมาก และครอบคลุมพื้นผิวนั้นทั้งหมด (หรือสแกนเป็นส่วน ๆ) การคำนวณจะ “ย้อน” สนามเสียงที่วัดได้กลับไปที่พื้นผิว ได้ทั้งความดันเสียง ความเร็วอนุภาค และความเข้มเสียงบนพื้นผิว ข้อดีคือความละเอียดไม่ได้ถูกจำกัดด้วยความยาวคลื่นแบบ Beamforming แต่ขึ้นกับระยะจากพื้นผิวและระยะห่างของไมโครโฟน จึงเหมาะกับความถี่ต่ำ ข้อจำกัดคือ ไมโครโฟนต้องถี่พอสำหรับความถี่สูงสุดที่ต้องการ และแผงต้องใหญ่พอกับพื้นผิวที่วัดNear-field acoustic holography (NAH) is another approach. The array is placed very close to the vibrating surface and covers all of it (or scans it in sections). The calculation “back-propagates” the measured field to the surface, giving sound pressure, particle velocity and intensity on the surface. Its advantage is that resolution is not limited by wavelength as in beamforming, but by the distance to the surface and the microphone spacing, so it suits low frequencies. Its limits are that the microphones must be dense enough for the highest frequency of interest and the array must be large enough for the surface being measured.
สรุปแบบคร่าว ๆ: Beamforming เหมาะกับระยะกลางถึงไกลและความถี่กลางถึงสูง ส่วน NAH เหมาะกับระยะใกล้มากและความถี่ต่ำ งานจริงจำนวนมากใช้ทั้งสองแบบร่วมกัน หรือใช้วิธีที่ผสมทั้งสองแนวคิดRoughly: beamforming suits medium to long distances and mid to high frequencies, while NAH suits very short distances and low frequencies. Much real work uses both, or methods that combine the two ideas.
ข้อจำกัดที่ต้องรู้Limitations to know
- เสียงสะท้อน: ในห้องหรือใกล้ผนัง เสียงสะท้อนทำหน้าที่เหมือนแหล่งเสียงเสมือนหลังพื้นผิว แผนที่อาจแสดงจุดเสียงบนผนังที่ไม่มีแหล่งเสียงจริงReflections: in rooms or near walls, reflections act like mirror sources behind the surface, and the map may show hot spots on walls where no real source exists.
- แหล่งเสียงที่สัมพันธ์กัน (Coherent sources): เช่น แผ่นโลหะสองจุดที่สั่นจากแรงเดียวกัน เสียงจากสองจุดจะแทรกสอดกัน วิธีคำนวณหลายแบบสมมุติว่าแหล่งเสียงไม่สัมพันธ์กัน ผลจึงอาจแสดงตำแหน่งหรือระดับผิดCoherent sources: for example, two points on a panel driven by the same force. Their sound interferes, and many algorithms assume uncorrelated sources, so positions or levels may be shown wrongly.
- ความลึก: แผงระนาบบอกตำแหน่งในแนวภาพได้ดี แต่บอกระยะห่างจากแผงได้ไม่ดีนัก ต้องกำหนดระยะวัดให้ถูกDepth: a planar array locates well across the picture but poorly in distance from the array, so the measuring distance must be set correctly.
- เสียงรบกวนจากทิศอื่น: แหล่งเสียงนอกภาพที่ดังมากอาจรั่วเข้ามาในแผนที่ผ่าน Side lobeNoise from other directions: a very loud source outside the picture can leak into the map through side lobes.
- แหล่งเสียงเคลื่อนที่และเปลี่ยนตามเวลา: รถที่วิ่งผ่านหรือเครื่องที่เปลี่ยนรอบต้องใช้การประมวลผลเฉพาะ และช่วงเวลาวิเคราะห์ที่เหมาะสมMoving and time-varying sources: passing vehicles or machines changing speed need special processing and suitable analysis periods.
เทียบกับความเข้มเสียงและเซนเซอร์ทิศทางCompared with sound intensity and direction sensors
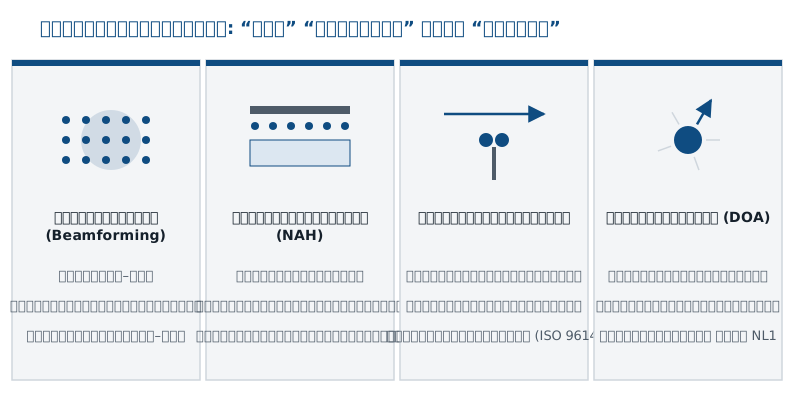
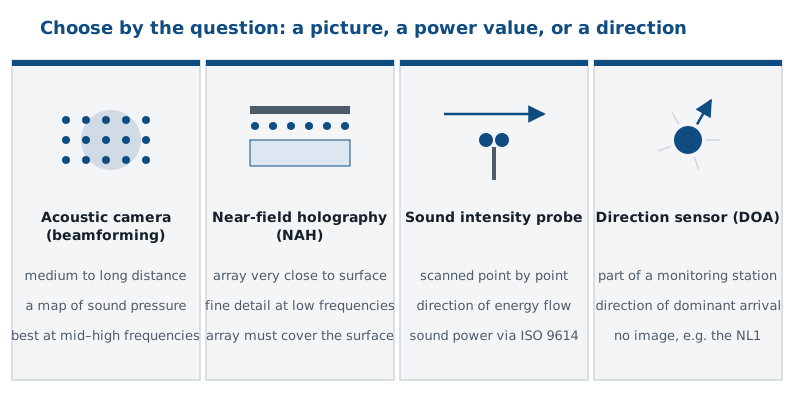
| วิธีMethod | คำถามที่ตอบQuestion answered | เหมาะกับSuited to |
|---|---|---|
| กล้องอะคูสติก (Beamforming)Acoustic camera (beamforming) | คำถามที่ตอบQuestion answeredเสียงออกมาจากตรงไหนในภาพWhere in the picture does the sound come from? | เหมาะกับSuited toหาจุดเสียงบนเครื่องจักร จุดรั่วของประตู ผนัง และช่องเปิด ที่ความถี่กลางถึงสูงHot spots on machines, leaks at doors, walls and openings, at mid to high frequencies |
| โฮโลกราฟีระยะใกล้ (NAH)Near-field holography (NAH) | คำถามที่ตอบQuestion answeredพื้นผิวส่วนไหนแผ่เสียง และแผ่อย่างไรWhich part of a surface radiates, and how? | เหมาะกับSuited toแผ่นหรือเปลือกเครื่องที่สั่น ความถี่ต่ำ ระยะใกล้มากVibrating panels or casings, low frequencies, very close range |
| หัววัดความเข้มเสียงSound intensity probe | คำถามที่ตอบQuestion answeredพลังงานไหลไปทางไหน และมีกำลังเสียงเท่าไรWhich way does energy flow, and what is the sound power? | เหมาะกับSuited toกำลังเสียงตาม ISO 9614 และหาจุดรั่วแบบสแกนทีละจุดSound power to ISO 9614, and point-by-point leak scanning |
| เซนเซอร์ทิศทาง (DOA)Direction sensor (DOA) | คำถามที่ตอบQuestion answeredเสียงที่เด่นมาจากทิศไหน ณ จุดติดตั้งFrom which direction does the dominant sound arrive at the station? | เหมาะกับSuited toสถานีเฝ้าระวังเสียงระยะยาวและเรื่องร้องเรียนLong-term monitoring stations and complaints |
ตัวอย่างของเซนเซอร์ทิศทางคือ Noise Locator NL1 ของ NTi Audio ซึ่ง ไม่ใช่กล้องอะคูสติก NL1 ใช้ไมโครโฟน 8 ตัวจัดเป็นหัววัดความเข้มเสียง 12 คู่ เพื่อบอกมุมราบและมุมเงยของเสียงที่เด่นที่สุดในแต่ละย่านออกเตฟ 63 Hz ถึง 4 kHz ร่วมกับเครื่องวัด XL3 ในสถานีเฝ้าระวัง มันไม่ได้สร้างภาพแผนที่ แต่ให้หลักฐานว่าเสียงมาจากทิศไหนตลอดช่วงการเฝ้าระวัง รายละเอียดอยู่ในบทความความเข้มเสียงและการหาทิศทางของเสียงAn example of a direction sensor is NTi Audio’s Noise Locator NL1, which is not an acoustic camera. The NL1 uses 8 microphones arranged as 12 intensity pairs to report the azimuth and elevation of the dominant sound in each octave band from 63 Hz to 4 kHz, working with the XL3 meter in a monitoring station. It does not produce a map image; it provides evidence of which direction the sound came from throughout the monitoring period. Details are in the article on sound intensity and direction of arrival.
ตัวอย่างสถานการณ์Example scenario
ห้องประชุมผู้บริหารได้ยินเสียงพูดจากห้องถัดไป ทั้งที่ผนังออกแบบให้กันเสียงได้ดี วิศวกรเปิดเสียงทดสอบในห้องข้าง ๆ แล้วใช้กล้องอะคูสติกส่องผนังจากฝั่งห้องประชุม ในย่าน 1–4 kHz แผนที่แสดงจุดเด่นที่ขอบบนของประตูและที่ช่องลมฝ้าเหนือผนัง แต่ตัวผนังเองไม่มีจุดเด่น ในย่าน 250 Hz ภาพพร่าเกินกว่าจะแยกประตูกับผนังได้ จึงใช้การวัดระดับเสียงใกล้พื้นผิวเสริม ผลนี้ชี้ว่าควรแก้ขอบยางประตูและช่องทางลมก่อนรื้อผนัง แล้ววัดการกันเสียงตามมาตรฐานยืนยันหลังแก้ไข (สถานการณ์สมมุติ ไม่ใช่โครงการจริง)An executive meeting room hears speech from the room next door, although the wall was designed to insulate well. The engineer plays a test signal in the adjacent room and views the wall with an acoustic camera from the meeting-room side. In the 1–4 kHz bands the map shows hot spots at the top edge of the door and at a ceiling air path above the wall, but none on the wall itself. At 250 Hz the picture is too blurred to separate the door from the wall, so close-range level measurements are added. The result points to fixing the door seals and the air path before tearing out the wall, followed by a standardised sound insulation test to confirm. (Hypothetical scenario, not a real project.)
ความผิดพลาดที่พบบ่อยCommon mistakes
- อ่านสีเป็นระดับเสียงจริง โดยไม่ดูว่าสเกลแสดงช่วงกี่ dB และอ้างอิงค่าอะไรReading colours as absolute levels without checking how many dB the scale spans and what it is referenced to.
- ใช้ภาพย่านกว้างเพียงภาพเดียว ทั้งที่แหล่งเสียงต่างกันเด่นคนละย่านความถี่Using one broadband picture only, although different sources dominate different bands.
- คาดหวังภาพคมที่ความถี่ต่ำ จากแผงขนาดเล็กExpecting a sharp low-frequency picture from a small array.
- เชื่อจุดเสียงบนผนังหรือพื้น โดยไม่ตรวจว่าเป็นเสียงสะท้อนTrusting hot spots on walls or floors without checking for reflections.
- ใช้แผนที่แทนการวัดตามมาตรฐาน เช่น กำลังเสียงหรือค่าการกันเสียง ซึ่งต้องวัดด้วยวิธีที่กำหนดUsing the map instead of a standardised measurement, such as sound power or sound insulation ratings, which require the specified methods.
คำถามที่พบบ่อยFrequently asked questions
กล้องอะคูสติกวัดค่า dB ได้แม่นไหมDoes an acoustic camera give accurate dB values?
แผนที่ให้ระดับสัมพัทธ์ระหว่างตำแหน่งได้ดี แต่ค่าตัวเลขที่แต่ละจุดขึ้นกับรูปแบบแผง วิธีคำนวณ และสภาพสนามเสียง ถ้าต้องการค่าที่ใช้ตัดสินตามเกณฑ์ ให้วัดด้วยเครื่องวัดระดับเสียงหรือวิธีมาตรฐานควบคู่กันThe map gives good relative levels between positions, but the number at each point depends on the array, the algorithm and the sound field. For values used against criteria, measure with a sound level meter or a standardised method alongside.
ความถี่ต่ำสุดที่ใช้ได้คือเท่าไรWhat is the lowest usable frequency?
ไม่มีตัวเลขเดียว ขึ้นกับขนาดแผง ระยะวัด และระยะห่างระหว่างแหล่งเสียงที่ต้องการแยก ใช้สูตรประมาณคร่าว ๆ R ≈ 1.22 · λ · z / D เป็นการตรวจเบื้องต้นว่าที่ความถี่นั้น จุดบนแผนที่น่าจะเล็กพอสำหรับงานหรือไม่ ผลจริงขึ้นกับแผงและวิธีประมวลผลของเครื่องที่ใช้There is no single number: it depends on the array size, the measuring distance and how far apart the sources to be separated are. Use the rough estimate R ≈ 1.22 · λ · z / D as a first check of whether the spot is likely to be small enough for the task at that frequency; the actual result depends on the array and processing of the instrument used.
NL1 เป็นกล้องอะคูสติกหรือไม่Is the NL1 an acoustic camera?
ไม่ใช่ NL1 เป็นเซนเซอร์บอกทิศทางที่ใช้หลักการความเข้มเสียง ติดกับสถานีเฝ้าระวัง บอกทิศของเสียงที่เด่นในแต่ละย่านออกเตฟ ไม่ได้สร้างภาพแผนที่No. The NL1 is a direction sensor based on sound intensity, mounted at a monitoring station, reporting the direction of the dominant sound in each octave band. It does not produce a map image.
ควรเลือกกล้องอะคูสติกหรือหัววัดความเข้มเสียงShould I choose an acoustic camera or an intensity probe?
ถ้าต้องการเห็นภาพรวมอย่างรวดเร็วว่าเสียงมาจากตรงไหน กล้องอะคูสติกเหมาะกว่า ถ้าต้องการค่ากำลังเสียงหรือการไหลของพลังงานที่ใช้ในรายงานตามมาตรฐาน หัววัดความเข้มเสียงเหมาะกว่า หลายงานใช้ทั้งสองอย่างFor a quick overview of where the sound comes from, an acoustic camera is the better fit. For sound power or energy-flow values used in a standardised report, an intensity probe fits better. Many jobs use both.
คำศัพท์สำคัญKey terms
- Beamforming
- การรวมสัญญาณจากไมโครโฟนหลายตัวโดยหน่วงเวลาให้ “เล็ง” ไปที่จุดหรือทิศที่ต้องการCombining signals from many microphones with delays so the array “points” at a chosen position or direction.
- กล้องอะคูสติก (Acoustic camera)Acoustic camera
- แผงไมโครโฟนร่วมกับกล้องภาพ แสดงแผนที่เสียงซ้อนบนภาพA microphone array with an optical camera, showing a sound map over the image.
- Main lobe / Side lobeMain lobe / side lobe
- วงหลักรอบแหล่งเสียงจริงซึ่งกำหนดความละเอียด / ระดับเทียมรอบ ๆ ที่จำกัดช่วงไดนามิกของแผนที่The main patch around a real source, which sets the resolution / artificial surrounding levels that limit the map dynamic range.
- Spatial aliasing (Grating lobes)Spatial aliasing (grating lobes)
- ภาพซ้ำหลอกเมื่อไมโครโฟนห่างกันมากเกินเทียบกับความยาวคลื่นRepeated false images when microphones are too far apart relative to the wavelength.
- NAH (Near-field acoustic holography)NAH (near-field acoustic holography)
- การวัดใกล้พื้นผิวมากแล้วคำนวณสนามเสียงย้อนกลับไปที่พื้นผิว เหมาะกับความถี่ต่ำMeasuring very close to a surface and calculating the field back to the surface; suited to low frequencies.
- DOA (Direction of arrival)DOA (direction of arrival)
- ทิศทางที่เสียงมาถึงจุดวัดThe direction from which sound arrives at the measuring point.