“ได้ยินเสียง แต่เสียงมาจากไหน?”“We can hear it — but where does it come from?”
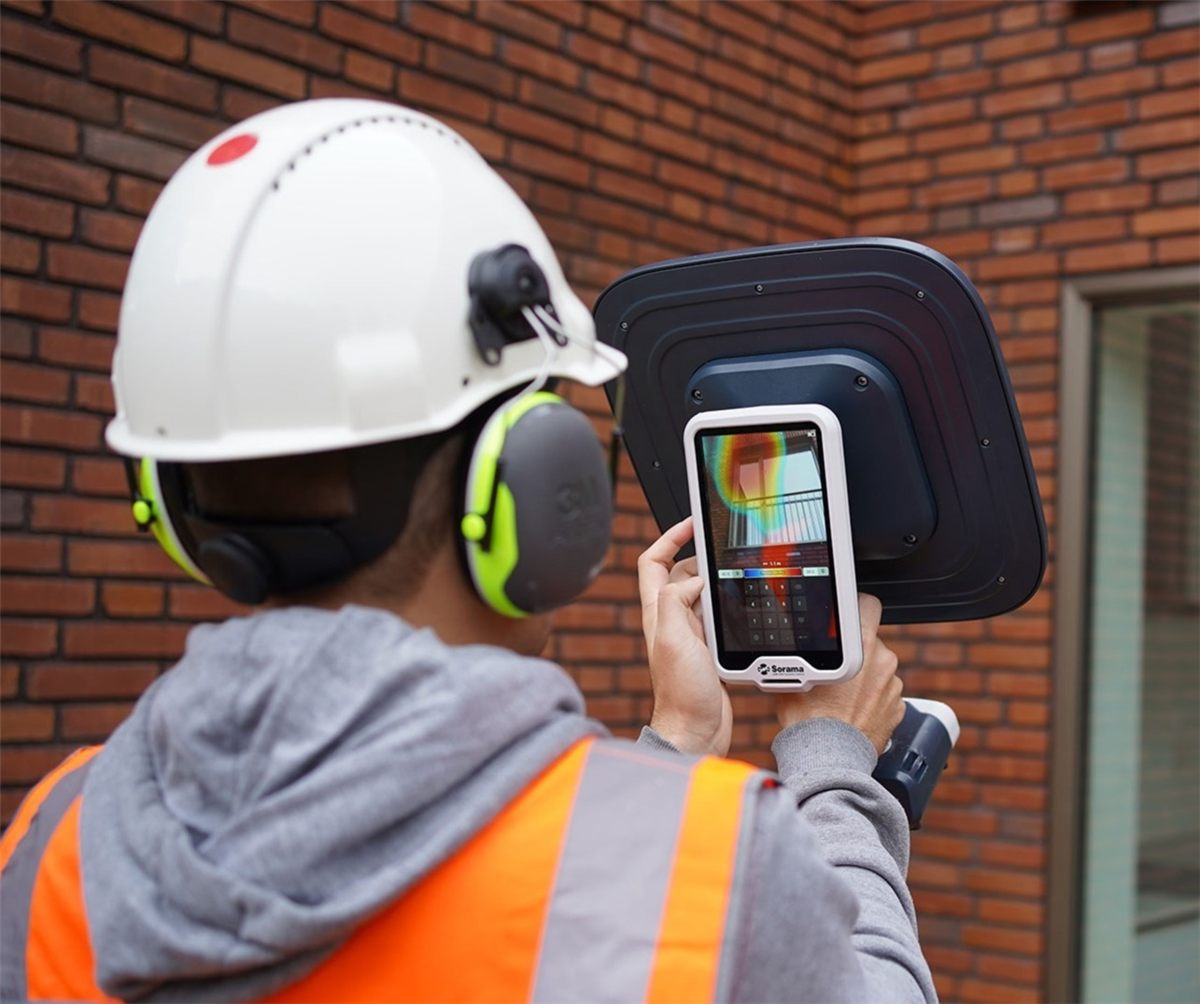
โจทย์เรื่องเสียงมักเริ่มจากประโยคเดียวกัน เพื่อนบ้านได้ยินเสียงหึ่งตอนกลางคืนจากหลังคาที่มีเครื่องจักรหลายชุด ห้องประชุมได้ยินเสียงจากทางเดินทั้งที่ผนังออกแบบมาดี หรือเครื่องจักรรุ่นใหม่ดังกว่ารุ่นเดิมโดยไม่รู้สาเหตุ ทุกกรณีมีคำถามเดียวกัน คือ เสียงส่วนใหญ่มาจากไหน ถ้าตอบผิด เงินค่าแก้ไขจะไปลงที่จุดที่ไม่ใช่ปัญหา เช่น ครอบเครื่องทั้งเครื่องทั้งที่เสียงหลักมาจากท่อลม หรือเปลี่ยนผนังทั้งแผงทั้งที่เสียงรั่วผ่านช่องใต้ประตูNoise problems tend to start with the same sentence. Neighbours hear a night-time hum from a roof carrying several plant units; a meeting room hears the corridor although its wall was designed well; a new machine is louder than the old model for no known reason. Each time the question is the same: where does most of the sound come from? A wrong answer sends the remedial budget to the wrong place, such as enclosing a whole machine when the main noise comes from a duct, or replacing a wall when the sound leaks through a gap under the door.
หน้านี้เล่าเส้นทางการทำงานทั้งหมด ตั้งแต่ วัด ให้รู้ว่าเสียงแบบไหนเป็นปัญหา มองเห็น ด้วยภาพแผนที่เสียง ระบุ ส่วนที่แผ่เสียง ตรวจสอบต่อ ตามย่านความถี่และสภาวะการทำงาน วินิจฉัย สาเหตุ จนถึง ปรับปรุง และวัดยืนยันผลThis page follows the whole path: measure to know which sound is the problem, visualize it with a sound map, identify the radiating part, investigate by frequency band and operating condition, diagnose the cause, and finally improve and confirm with a new measurement.
การระบุตำแหน่งแหล่งกำเนิดเสียงคืออะไรWhat is sound source localization?
การวัดเสียงทั่วไปด้วยเครื่องวัดระดับเสียงให้ข้อมูลสองอย่าง คือ ระดับ (ดังกี่เดซิเบล) และ ความถี่ (พลังงานอยู่ที่ย่านใด) ซึ่งจำเป็นสำหรับการประเมินตามเกณฑ์และมาตรฐาน การระบุตำแหน่งแหล่งกำเนิดเสียงเพิ่มข้อมูลอย่างที่สาม คือ ตำแหน่ง ว่าเสียงในย่านความถี่นั้นออกมาจากส่วนใดของเครื่องหรือพื้นผิว ผลที่ได้จึงเป็นภาพ ไม่ใช่ตัวเลขตัวเดียวOrdinary measurement with a sound level meter gives two things: the level (how many decibels) and the frequency content (where the energy is). Both are essential for assessment against limits and standards. Sound source localization adds a third: the location, showing which part of a machine or surface the sound in a given frequency band comes from. The result is an image rather than a single number.
| คำถามQuestion | เครื่องวัดระดับเสียงSound level meter | การระบุตำแหน่งแหล่งเสียงSound source localization |
|---|---|---|
| ดังเท่าไรHow loud? | เครื่องวัดระดับเสียงSound level meterใช่ เป็นหน้าที่หลัก และใช้กับเกณฑ์ตามมาตรฐานได้เมื่อเครื่องผ่านการรับรองและสอบเทียบYes: its main job, and usable against standard limits when the instrument is certified and calibrated | การระบุตำแหน่งแหล่งเสียงSound source localizationบอกความแรงเชิงเปรียบเทียบบนภาพ ไม่ได้แทนการวัดระดับตามมาตรฐานShows relative strength on the image; does not replace a standardised level measurement |
| ความถี่ใดWhich frequencies? | เครื่องวัดระดับเสียงSound level meterใช่ ด้วยการวิเคราะห์ออกเตฟหรือ FFTYes, with octave or FFT analysis | การระบุตำแหน่งแหล่งเสียงSound source localizationใช่ เลือกย่านความถี่แล้วดูแผนที่เฉพาะย่านนั้นYes: select a band and view the map for that band only |
| มาจากตรงไหนWhere from? | เครื่องวัดระดับเสียงSound level meterไม่บอกโดยตรงNot directly | การระบุตำแหน่งแหล่งเสียงSound source localizationใช่ เป็นหน้าที่หลักYes: its main job |
สองวิธีนี้เสริมกัน ไม่ได้แทนกัน การวัดที่จุดรับฟังด้วยเครื่องวัดระดับเสียงบอกว่า ต้องแก้เสียงไหน ส่วนภาพแผนที่เสียงบอกว่า เสียงนั้นออกมาจากตรงไหนThe two complement each other rather than compete. A sound level meter at the receiver tells you which sound must be fixed; a sound map tells you where that sound comes out.
โจทย์ที่พบบ่อย: เสียงโทน และภาพที่ไม่ใช่คำวินิจฉัยA common problem: tonal noise, and a map is not a diagnosis
เสียงที่คนร้องเรียนบ่อยมักมี องค์ประกอบโทน คือเสียงหึ่งหรือเสียงหวีดที่ความถี่ค่อนข้างคงที่ เช่น จากพัดลม มอเตอร์ ปั๊ม หรือหม้อแปลง เสียงแบบนี้รบกวนมากแม้ระดับรวมไม่สูง และมักถูกกลบในค่ารวม เมื่อเลือกย่านความถี่รอบโทนนั้นแล้วดูภาพแผนที่ จะเห็นได้ว่าส่วนใดแผ่เสียงนั้นออกมามากที่สุดThe sounds people complain about often contain a tonal component: a hum or whine at a fairly constant frequency, for example from a fan, motor, pump or transformer. Such sounds annoy even when the overall level is modest, and they are easily hidden in the overall value. Selecting a frequency band around the tone and viewing the map shows which part radiates it most.
แต่ การรู้ตำแหน่งยังไม่ใช่การรู้สาเหตุ จุดที่ภาพแสดงสีเข้มคือบริเวณที่เสียงแผ่ออกมาหรือลอดออกมา อาจเป็นฝาครอบที่ถูกเขย่าด้วยการสั่นจากชิ้นส่วนอื่น ช่องรั่วที่ปล่อยเสียงจากอีกห้อง หรือท่อที่รับการสั่นมาจากปั๊ม การหาสาเหตุทางกลไกต้องใช้ข้อมูลเพิ่ม เช่น การวิเคราะห์ความถี่เทียบกับรอบหมุน การวัดการสั่นสะเทือน การทดสอบเปิดปิด และความรู้เรื่องระบบนั้นBut knowing the location is not the same as knowing the cause. The strong area on a map is where sound radiates or escapes. It may be a cover shaken by vibration from another part, a gap letting sound through from another room, or a pipe carrying vibration from a pump. Finding the mechanical cause needs more information: frequency analysis against rotation speed, vibration measurement, on/off tests and knowledge of the system.
ทำไมการหาต้นเสียงจึงยากWhy finding the source is difficult
- หลายแหล่งดังพอ ๆ กัน ปิดแหล่งหนึ่ง ระดับรวมลดลงเพียงเล็กน้อย (สองแหล่งที่ดังเท่ากัน ปิดไปหนึ่งแหล่ง ระดับลดประมาณ 3 dB) จึงดูเหมือน “ไม่ได้ผล” ทั้งที่แก้ถูกจุดSeveral sources of similar level: switching one off lowers the total only a little (two equal sources, one off, about 3 dB less), so a correct fix can look “ineffective”.
- เสียงสะท้อน ในห้องหรือระหว่างอาคาร เสียงสะท้อนทำให้หูและไมโครโฟนรับรู้ทิศทางผิดReflections: in rooms or between buildings they mislead both ears and microphones about direction.
- สนามใกล้และสนามไกล ใกล้เครื่องมาก ระดับเปลี่ยนเร็วตามตำแหน่งและถูกครอบงำโดยส่วนที่อยู่ใกล้ที่สุด ไกลออกไป แหล่งต่าง ๆ รวมกันจนแยกยากNear field and far field: very close to a machine the level changes quickly and is dominated by the nearest part; far away the sources merge and are hard to separate.
- ความถี่ต่ำ ความยาวคลื่นยาวหลายเมตร หูบอกทิศได้ยาก และในห้องจะเกิดจุดดังจุดเบาตามโหมดของห้องLow frequencies: wavelengths of several metres make direction hard to hear, and rooms create loud and quiet spots from room modes.
- เสียงผ่านโครงสร้าง การสั่นเดินทางผ่านโครงสร้างแล้วแผ่เป็นเสียงจากแผ่นผนังหรือเพดานที่อยู่ไกลจากต้นเหตุStructure-borne sound: vibration travels through the structure and radiates from a wall or ceiling panel far from the real cause.
สองวิธีในการ “มองเห็น” เสียงTwo ways to see sound
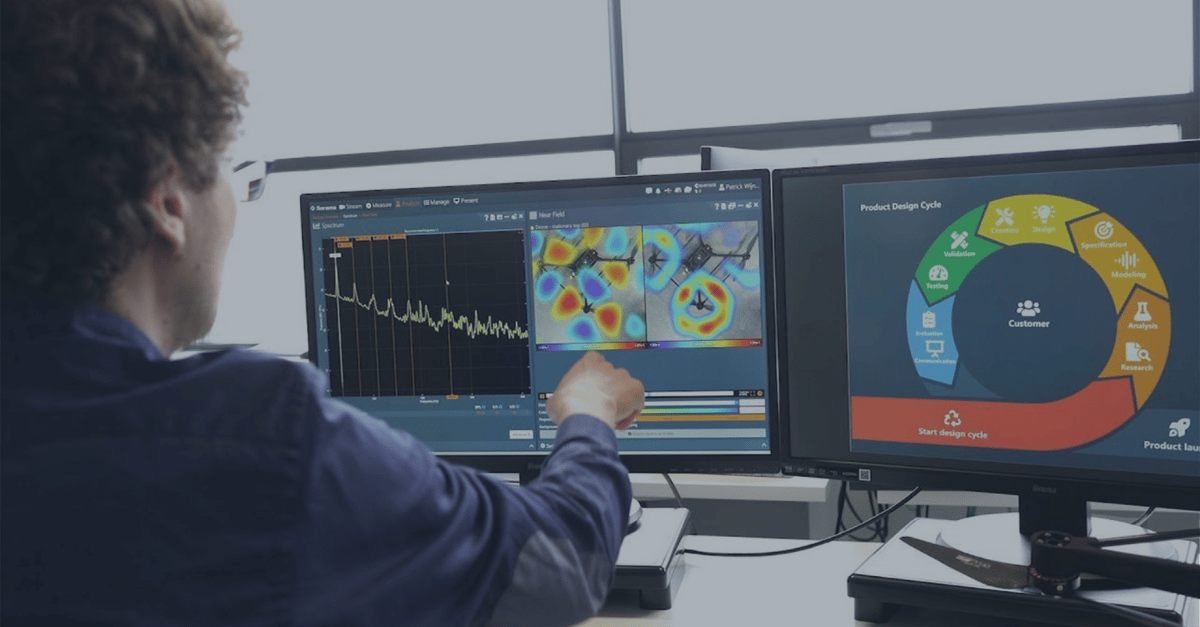
ภาพแผนที่เสียงสร้างได้หลายหลักการ GET BEST SOUND ใช้สองแนวทางที่ต่างกันโดยพื้นฐาน แนวทางแรกคือ อาร์เรย์ไมโครโฟนที่วัดจากระยะห่าง ไมโครโฟนหลายตัวรับเสียงพร้อมกัน ซอฟต์แวร์คำนวณว่าเสียงมาจากทิศใดแล้ววาดเป็นภาพทันที เหมาะกับการมองภาพรวมของพื้นที่ แนวทางที่สองคือ หัววัดตัวเดียวที่สแกนใกล้ผิว ผู้วัดเลื่อนหัววัดไปทั่วพื้นผิวขณะกล้องบันทึกตำแหน่ง แล้วซอฟต์แวร์ต่อข้อมูลเป็นแผนที่ละเอียด เหมาะกับการดูรายละเอียดของบริเวณที่สนใจSound maps can be made on several principles. GET BEST SOUND uses two that are fundamentally different. The first is a microphone array measuring from a distance: many microphones capture the sound at once, software works out where it comes from and draws the image immediately; it suits an overview of an area. The second is a single probe scanned close to the surface: the operator moves the probe over the surface while a camera records its position, and software assembles the data into a detailed map; it suits detail on a region of interest.
ทั้งสองวิธีไม่ได้แข่งกันว่าใครดีกว่า แต่ตอบคำถามต่างขนาดกัน ส่วนถัดไปอธิบายแต่ละวิธีตามที่ผู้ผลิตระบุ แล้วจึงเปรียบเทียบและบอกว่าควรเลือกอย่างไรThe two are not competing to be “better”; they answer questions at different scales. The next sections describe each as its manufacturer documents it, then compare them and explain how to choose.
กล้องเสียง (Acoustic camera) คืออะไร: Sorama CAM iV64What is an acoustic camera? The Sorama CAM iV64
กล้องเสียง คืออุปกรณ์ที่รวมอาร์เรย์ไมโครโฟนเข้ากับกล้องภาพ ไมโครโฟนแต่ละตัวรับเสียงเดียวกันจากตำแหน่งต่างกันเล็กน้อย ซอฟต์แวร์เปรียบเทียบสัญญาณเหล่านั้นเพื่อประมาณทิศทางและความแรงของแหล่งเสียง แล้วแสดงผลเป็นแผนที่สีซ้อนบนภาพหรือวิดีโอ Sorama CAM iV64 เป็นกล้องเสียงแบบถือด้วยมือที่มีจอสัมผัสขนาด 7 นิ้ว คู่มือของ Sorama เรียกหลักการที่ใช้ว่า Beamforming (far-field) ซึ่งคำนวณตำแหน่งจากความต่างของเวลาที่เสียงมาถึงไมโครโฟนแต่ละตัว และเรียกภาพที่ได้ว่า SoundSurfaceAn acoustic camera combines a microphone array with a visual camera. Each microphone captures the same sound from a slightly different position; software compares the signals to estimate the direction and strength of the source and shows the result as a colour map over an image or video. The Sorama CAM iV64 is a handheld acoustic camera with a 7-inch touchscreen. Sorama's manual calls its principle beamforming (far-field), which locates sound from the differences in arrival time at each microphone, and calls the resulting image a SoundSurface.
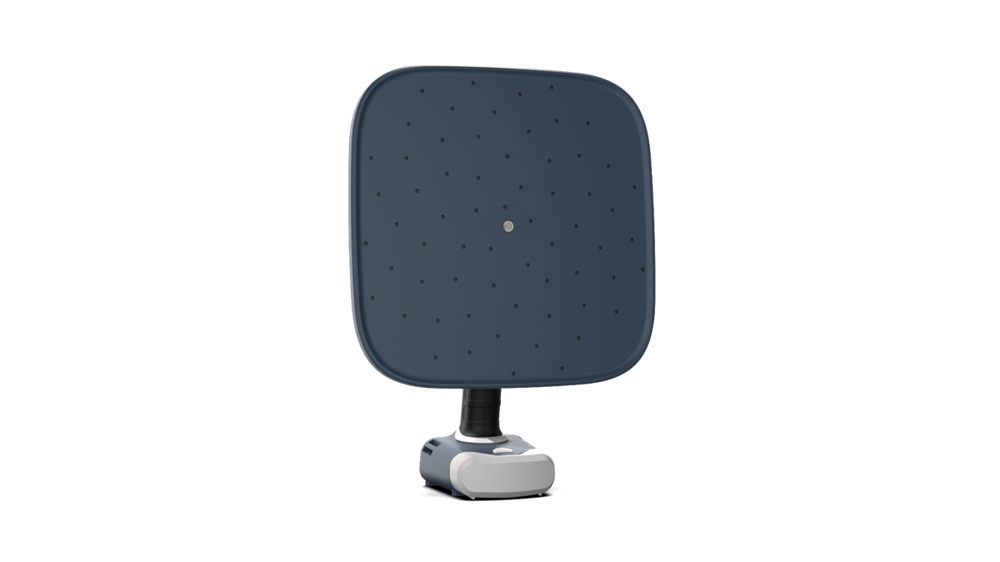
- อ่านแผนที่อย่างไร: สีบนภาพบอกบริเวณที่เสียงในย่านความถี่ที่เลือกมาถึงอาร์เรย์แรงที่สุด เป็นความแรงเชิงเปรียบเทียบภายในภาพ คู่มือของ Sorama ระบุว่าค่า dB ที่ตัวชี้บนภาพแสดง ไม่ใช่ระดับความดันเสียงสัมบูรณ์ ค่าขึ้นกับย่านความถี่ที่เลือกและระยะ และอาจต่ำกว่าค่าจากเครื่องวัดระดับเสียงใกล้ ๆReading the map: the colour shows where sound in the selected band reaches the array most strongly; it is a relative strength within the image. Sorama's manual states that the dB value of the on-screen marker is not an absolute sound pressure level: it depends on the selected band and distance and may be lower than a nearby sound level meter reading.
- เลือกย่านความถี่: ลากขอบบนสเปกตรัมหรือสเปกโตรแกรมที่แสดงแบบเรียลไทม์ เพื่อให้แผนที่แสดงเฉพาะย่านที่สนใจ เช่น ย่านรอบโทนที่เป็นปัญหาFrequency selection: drag the limits on the real-time spectrum or spectrogram so the map shows only the band of interest, for example the band around a problem tone.
- โหมดแหล่งเสียง: คู่มือระบุสองโหมด คือ Multi-source แสดงหลายแหล่งพร้อมกัน และ Single-source แสดงเฉพาะแหล่งที่เด่นที่สุดSource modes: the manual lists Multi-source, showing several sources at once, and Single-source, showing only the most dominant one.
- ฟังเฉพาะทิศ (Directional Listening): เน้นเสียงภายในวงกลมบนจอและลดเสียงรอบนอก ฟังผ่านหูฟังบลูทูธได้แบบเรียลไทม์ และมีตัวบอกเมื่อพบแหล่งเสียงนอกขอบภาพDirectional Listening: emphasises sound inside a circle on the screen and reduces the rest, for real-time listening on Bluetooth headphones; a marker also appears when a source is detected outside the field of view.
- ระยะและย่านความถี่ตามสเปก: คู่มือ (ฉบับ 2.20 ธันวาคม 2025) ระบุระยะทำงาน 0.3 m ถึง 120 m การวิเคราะห์สเปกตรัม 29 Hz ถึง 27 kHz และการทำแผนที่แบบ Beamforming (far-field) 500 Hz ถึง 27 kHzDistance and frequency range as specified: the manual (version 2.20, December 2025) lists an operating distance of 0.3 m to 120 m, spectrum analysis from 29 Hz to 27 kHz and beamforming (far-field) mapping from 500 Hz to 27 kHz.
- บันทึกและรายงาน: บันทึกเป็นภาพนิ่ง (PNG) วิดีโอมาตรฐาน (WEBM) หรือข้อมูลดิบ RAW (.sor) ซึ่งนำไปวิเคราะห์ต่อและจัดทำรายงานใน Sorama Portal ได้Recording and reporting: results can be saved as an image (PNG), a standard video (WEBM) or RAW data (.sor), which can be analysed further and reported in the Sorama Portal.
- ระดับเสียงแบบมาตรฐาน: หน้าผลิตภัณฑ์ของ Sorama ระบุว่า CAM iV64 ไม่ใช่เครื่องวัดระดับเสียง Class 1 แต่ใช้ร่วมกับเครื่องที่ผ่านการรับรองได้ คู่มือระบุว่าต่อกับ NTi XL2 หรือ XL3 เพื่อแสดงระดับเสียงที่วัดโดยเครื่อง NTi บนจอได้Standardised levels: Sorama's product page states that the CAM iV64 is not a Class 1 meter but is compatible with certified instruments; the manual describes connecting an NTi XL2 or XL3 so that levels measured by the NTi instrument are shown on screen.
Sorama ไม่ได้ระบุจำนวนไมโครโฟนไว้ในคู่มือและเอกสารสเปกฉบับปัจจุบันที่เราตรวจ ระบุเพียงว่าเป็นไมโครโฟนชนิด MEMS ข้อมูลของ NTi Audio ซึ่งจำหน่ายกล้องรุ่นนี้ระบุว่ามีไมโครโฟน MEMS 64 ตัวเรียงแบบลายดอกทานตะวันSorama does not state the microphone count in the current manual and specification sheet we checked; they only state MEMS microphones. NTi Audio, which sells this camera, states 64 MEMS microphones in a sunflower pattern.
งานที่เหมาะ (ตามที่ Sorama ระบุ): หาจุดที่อากาศหรือเสียงรั่วผ่านโครงสร้าง เสียงโทน และเสียงจากอุปกรณ์ที่ไม่ต้องการ ในอาคาร พื้นที่สาธารณะ และงานพัฒนาผลิตภัณฑ์ จุดเด่นคือเห็นผลทันทีบนจอขณะเล็งกล้องไปรอบพื้นที่ จึงสำรวจภาพรวมได้เร็วและใช้สื่อสารกับผู้เกี่ยวข้องได้ง่ายTypical applications (as Sorama lists them): finding air and sound leakage through structures, tonal noise and unwanted equipment noise in buildings, public spaces and product development. Its strength is the immediate on-screen result while aiming around an area, which makes surveys fast and results easy to communicate.
ข้อจำกัดและการตีความ: Sorama ระบุว่า CAM iV64 เป็นเครื่องมือภาคสนามที่ผู้ใช้ต้องเล็งเอง ไม่ใช่อุปกรณ์เฝ้าระวังต่อเนื่องหรือระยะไกล นอกจากนี้ แผนที่แบบ Beamforming ของรุ่นนี้เริ่มที่ 500 Hz ตามสเปก เสียงหึ่งความถี่ต่ำกว่านั้นจึงดูได้บนสเปกตรัมแต่ไม่ได้เป็นภาพแผนที่ กล้องเสียงไม่มองทะลุผนัง ภาพแสดงเสียงที่มาถึงอาร์เรย์จากพื้นผิวและช่องเปิดที่อยู่ในมุมมอง เสียงสะท้อนอาจทำให้เกิดจุดที่ไม่ใช่แหล่งจริง และภาพไม่ได้บอกสาเหตุทางกลไกโดยอัตโนมัติLimitations and interpretation: Sorama states that the CAM iV64 is a field tool that must be aimed by the user, not a continuous or remote monitoring device. Its beamforming maps start at 500 Hz according to the specification, so a hum below that can be seen on the spectrum but not as a map. An acoustic camera does not see through walls: the image shows sound arriving at the array from the surfaces and openings in view. Reflections can create spots that are not real sources, and the image does not reveal the mechanical cause automatically.
Scan & Paint 2D คืออะไร: MicroflownWhat is Scan & Paint 2D? Microflown
Scan & Paint 2D ของ Microflown เป็นระบบทำภาพแผนที่เสียงด้วย หัววัด PU ตัวเดียว แทนอาร์เรย์ไมโครโฟน ผู้วัดเลื่อนหัววัดด้วยมือไปทั่วพื้นผิวของวัตถุในระยะใกล้ ขณะที่กล้องบันทึกการเคลื่อนที่ ข้อมูลเสียงและวิดีโอถูกซิงโครไนซ์กัน แล้วซอฟต์แวร์ VELO จับคู่ข้อมูลเสียงแต่ละช่วงกับตำแหน่งของหัววัด เพื่อ “ระบาย” แผนที่สีลงบนภาพของวัตถุ Microflown ระบุว่าระบบนี้ออกแบบมาสำหรับ สนามเสียงที่คงที่ตามเวลา (stationary) คือเสียงที่ไม่เปลี่ยนไปมากระหว่างที่สแกนMicroflown's Scan & Paint 2D makes sound maps with a single PU probe instead of a microphone array. The operator moves the probe by hand over the object's surface at close range while a camera records the movement. The sound data and video are synchronised, and the VELO software links each part of the sound data to the probe's position so that a colour map is “painted” over the image of the object. Microflown states that the system is designed for time-stationary sound fields, meaning sound that does not change much during the scan.
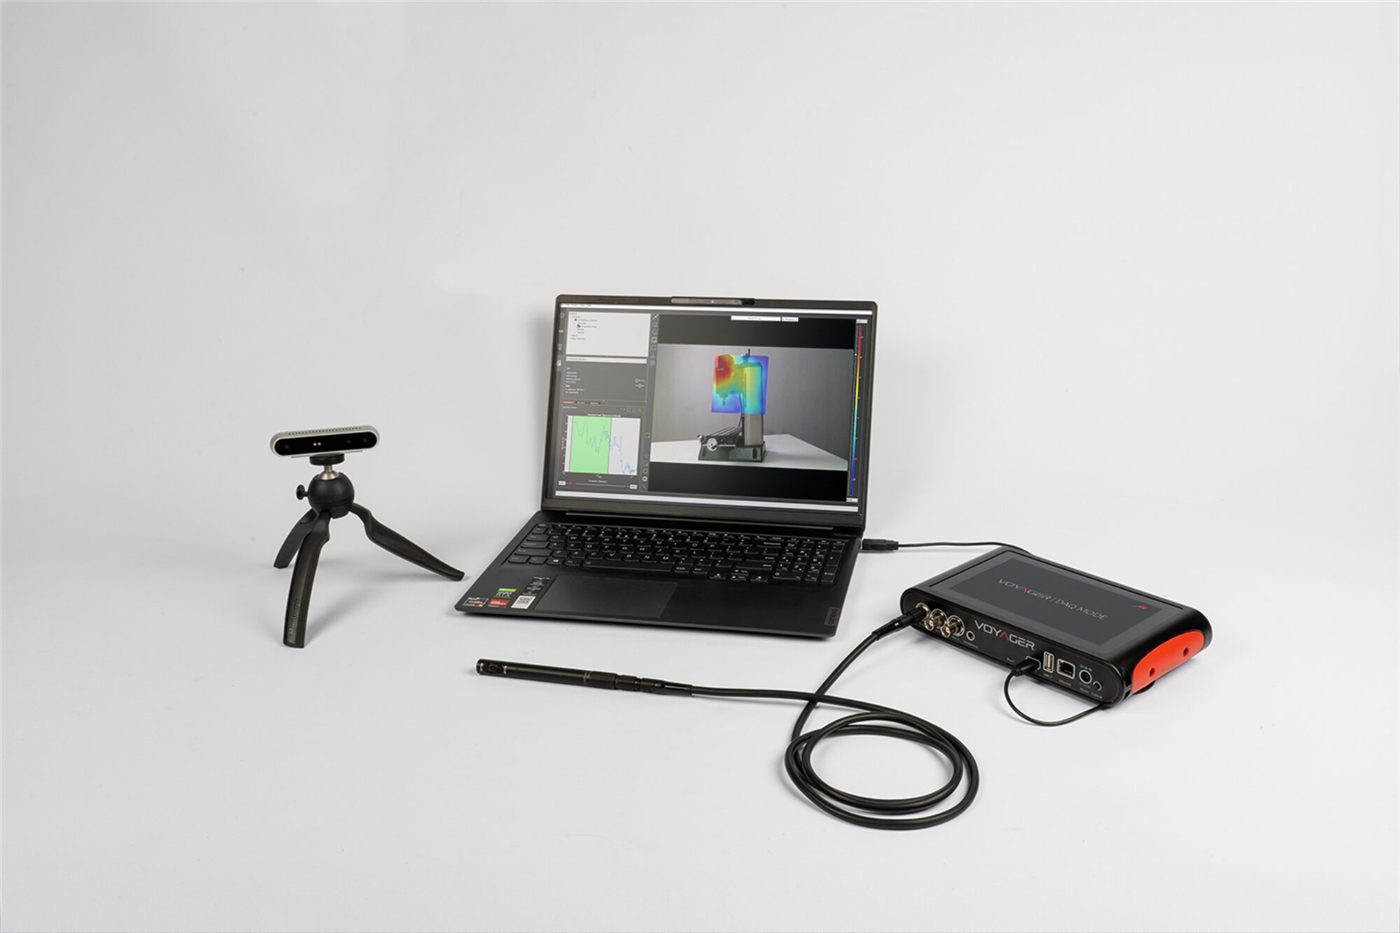
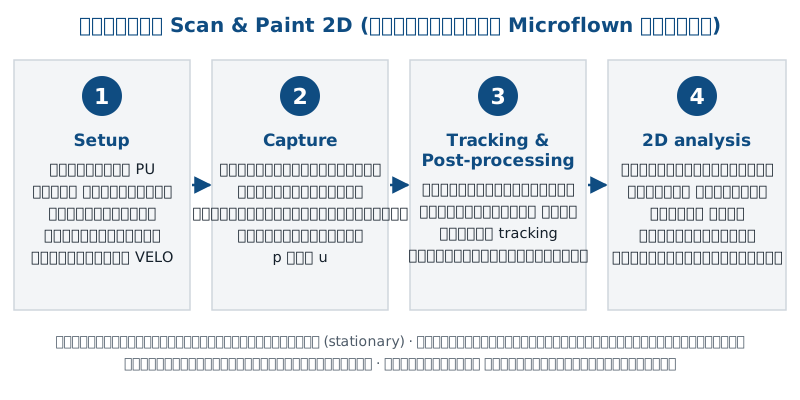
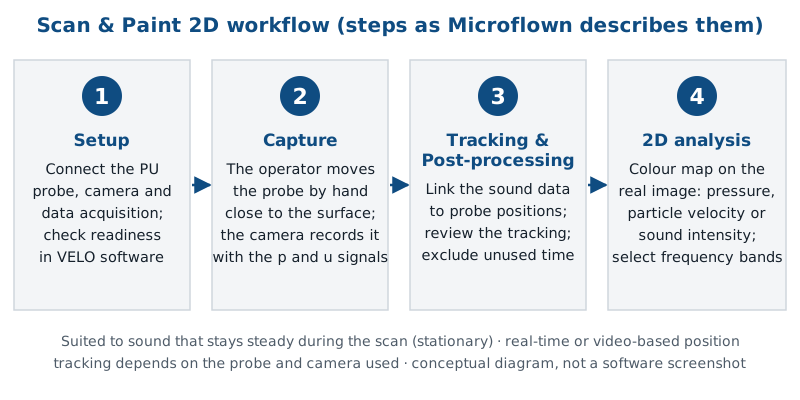
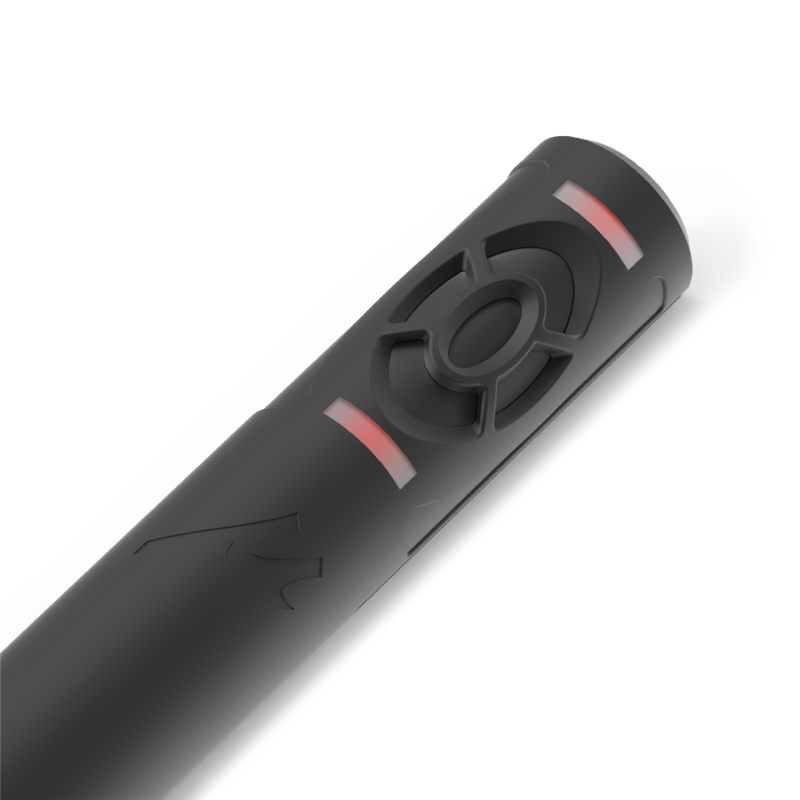
- ติดตามตำแหน่งหัววัด: Microflown อธิบายสองแบบ แบบแรกใช้หัววัด PU Regular GEN2 ที่มีไฟ IR LED ในตัวร่วมกับกล้องวัดความลึก Intel RealSense เพื่อติดตามตำแหน่งแบบเรียลไทม์ แบบที่สองใช้กล้องทั่วไปบันทึกการสแกน แล้วหาตำแหน่งภายหลังจากเครื่องหมายสีบนหัววัดProbe tracking: Microflown describes two ways. One uses the PU Regular GEN2 probe's built-in IR LEDs with an Intel RealSense depth camera for real-time tracking; the other records the scan with a standard camera and finds the position afterwards from a colour marker on the probe.
- ระยะและความเร็วในการสแกน: Microflown แนะนำระยะหัววัดถึงผิว 1 ถึง 5 cm สำหรับหาตำแหน่งแหล่งเสียง และ 5 ถึง 10 cm สำหรับงานความเข้มเสียง ความเร็วสแกนประมาณ 5 ถึง 10 cm/s การสแกนช้าลงหรืออยู่ในแต่ละช่องนานขึ้นให้ค่าทางสถิติที่ดีขึ้นที่ความถี่ต่ำDistance and scanning speed: Microflown recommends 1 to 5 cm between probe and surface for source localization and 5 to 10 cm for sound intensity, at a scanning speed of about 5 to 10 cm/s. Scanning more slowly, or spending longer in each cell, gives better statistics at low frequencies.
- สิ่งที่แผนที่แสดง: เลือกแสดงเป็นความดันเสียง ความเร็วอนุภาคเสียง หรือความเข้มเสียง และเลือกย่านความถี่จากสเปกตรัมเพื่อดูว่าส่วนใดแผ่เสียงในย่านนั้นWhat the map shows: sound pressure, acoustic particle velocity or sound intensity, with a frequency band selected from the spectrum to see which part radiates in that band.
- ย่านความถี่: Microflown ระบุว่าระบบครอบคลุม 20 Hz ถึง 14 kHz และระบุว่าใกล้แหล่งเสียง ผลของสนามใกล้ทำให้สัญญาณความเร็วอนุภาคที่ความถี่ต่ำแรงขึ้น จึงมีประโยชน์กับปัญหาเสียงความถี่ต่ำFrequency range: Microflown states a range of 20 Hz to 14 kHz, and that close to a source near-field effects strengthen the particle velocity signal at low frequencies, which helps with low-frequency problems.
- เครื่องมือวิเคราะห์เพิ่ม (ขึ้นกับระดับไลเซนส์ซอฟต์แวร์): สเปกตรัมและสเปกโตรแกรมของช่วงที่เลือก การเลือกพื้นที่เพื่อเทียบและจัดอันดับกำลังเสียง แผนที่ความเข้มเสียงแบบ reactive และ coherence การส่งออกข้อมูล และโมดูลเฉพาะทาง เช่น Transmission Loss และ Transfer Path AnalysisFurther analysis tools (depending on the software licence level): spectra and spectrograms of selected sections, area selection for comparison and sound power ranking, reactive intensity and coherence mapping, data export, and specialised modules such as Transmission Loss and Transfer Path Analysis.
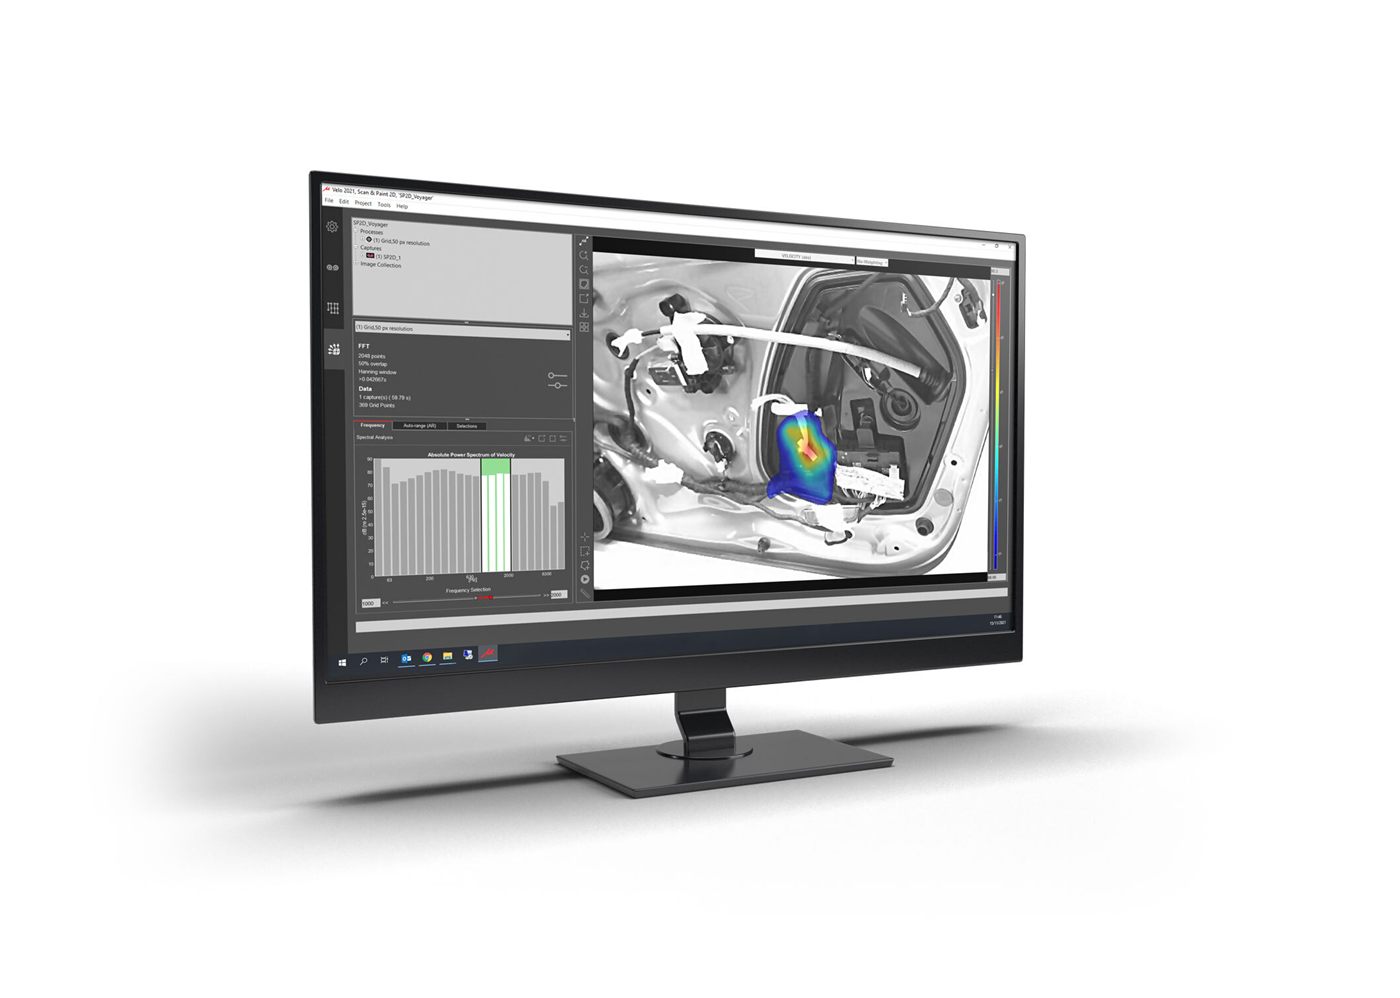
งานที่เหมาะ (ตามที่ Microflown ระบุ): แก้ปัญหาเสียงของผลิตภัณฑ์และเครื่องจักร หาจุดรั่วของเสียง วิเคราะห์การแผ่เสียงของแผ่นและตัวครอบ เสียงระบบปรับอากาศ คอมเพรสเซอร์ เครื่องใช้ไฟฟ้า และตรวจผลของการกันเสียงและวัสดุลดการสั่น ใช้ได้ทั้งวัตถุขนาดเล็กและใหญ่ในสภาพแวดล้อมการทำงานจริง โดยไม่ต้องใช้ห้องไร้เสียงสะท้อนTypical applications (as Microflown lists them): troubleshooting product and machinery noise, acoustic leakage detection, radiation from panels and enclosures, HVAC noise, compressors, appliances, and validating soundproofing and damping. It works on small and large objects in real operating environments without an anechoic room.
ข้อจำกัดและการตีความ: Scan & Paint 2D ไม่ได้ให้ภาพทันทีทั้งพื้นที่แบบกล้องเสียง ผลขึ้นกับการสแกนของผู้วัด ต้องเข้าถึงพื้นผิวได้ในระยะไม่กี่เซนติเมตร และเหมาะกับเสียงที่คงที่ตลอดการสแกน เสียงที่เกิดเป็นครั้งคราว เปลี่ยนรอบ หรือดังเป็นช่วงสั้น ๆ จะทำให้แผนที่ผิดเพี้ยนได้ ถ้าไม่ได้ใช้เซนเซอร์อ้างอิง แผนที่ที่ได้จากการสแกนต่างเวลากันไม่มีข้อมูลเฟสร่วมกัน ความละเอียดที่ดีใกล้ผิวไม่ได้แปลว่าวิธีนี้แม่นกว่าหรือเหมาะกว่าในทุกงานLimitations and interpretation: Scan & Paint 2D does not give an instant image of a whole area as an acoustic camera does. Results depend on the operator's scan, the surface must be reachable within a few centimetres, and the sound must stay steady during the scan: intermittent sound, changing speed or short events can distort the map. Without a reference sensor, points scanned at different times share no phase information. Fine detail close to the surface does not make the method more accurate or more suitable for every job.
หัววัด PU วัดอะไร: ความเร็วอนุภาคเสียงอธิบายแบบง่ายWhat does a PU probe measure? Particle velocity made simple
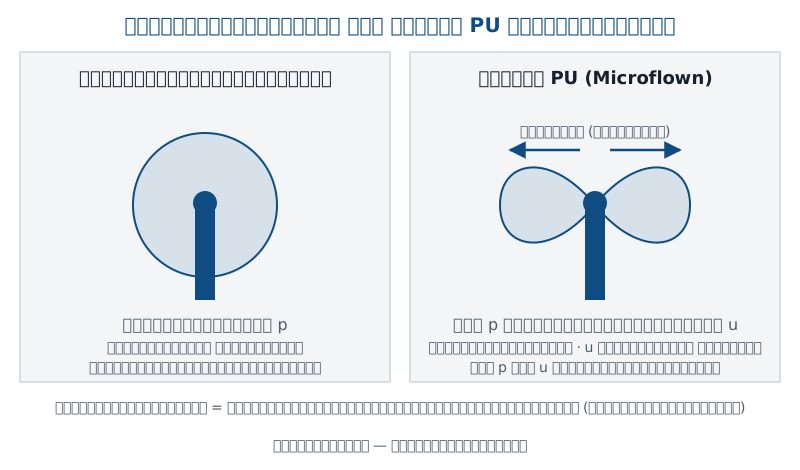
เมื่อคลื่นเสียงเดินทางผ่านอากาศ มีสองสิ่งเกิดขึ้นพร้อมกัน ความดันอากาศสูงขึ้นและต่ำลงเล็กน้อยรอบค่าปกติ และอนุภาคอากาศขยับไปมาเล็กน้อยตามแนวที่คลื่นเคลื่อนที่ ไมโครโฟนทั่วไปวัดเฉพาะอย่างแรก ส่วน หัววัด PU ของ Microflown วัดทั้งสองอย่าง ณ จุดเดียวกัน ตัว P คือไมโครโฟนวัดความดันเสียง ตัว U คือเซนเซอร์ Microflown ที่วัดความเร็วอนุภาคเสียงโดยตรงWhen a sound wave travels through air, two things happen at once: the air pressure rises and falls slightly around its normal value, and the air particles move back and forth slightly along the direction of travel. An ordinary microphone measures only the first. Microflown's PU probe measures both at the same point: P is a pressure microphone and U is a Microflown sensor that measures acoustic particle velocity directly.
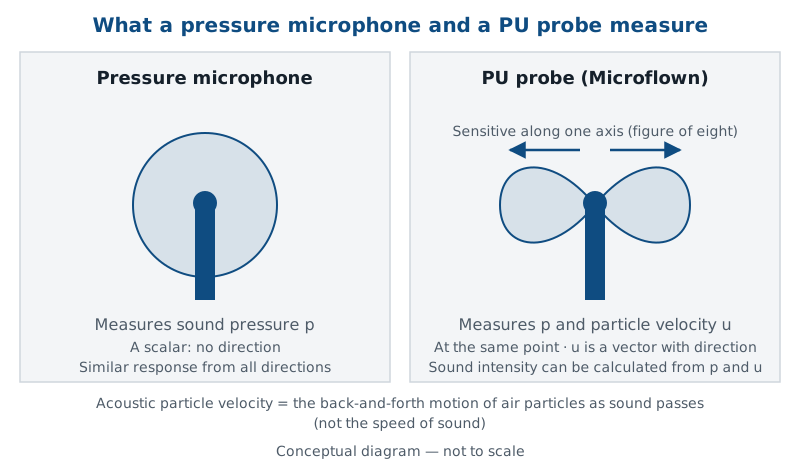
- ความดันเสียง (sound pressure, p)Sound pressure (p)
- การเปลี่ยนแปลงความดันอากาศที่เกิดจากเสียง เป็นปริมาณสเกลาร์ ไม่มีทิศทาง ใช้คำนวณระดับความดันเสียงที่เครื่องวัดระดับเสียงแสดงThe change in air pressure caused by sound; a scalar with no direction. It gives the sound pressure level shown by a sound level meter.
- ความเร็วอนุภาคเสียง (acoustic particle velocity, u)Acoustic particle velocity (u)
- ความเร็วที่อนุภาคอากาศสั่นไปมาเมื่อเสียงผ่าน ไม่ใช่ความเร็วเสียงที่คลื่นเดินทาง เป็นปริมาณเวกเตอร์ มีทั้งขนาดและทิศทางHow fast the air particles oscillate as sound passes, not the speed at which the wave travels; a vector with magnitude and direction.
- ความเข้มเสียง (sound intensity)Sound intensity
- การไหลของพลังงานเสียงผ่านพื้นที่ มีทิศทาง หัววัด PU คำนวณได้จากความดันและความเร็วอนุภาคที่วัดพร้อมกัน ใช้แยกพลังงานที่ออกจากพื้นผิวจริง และใช้คำนวณกำลังเสียงThe flow of sound energy through an area, with direction. A PU probe calculates it from pressure and particle velocity measured together; it separates energy really leaving a surface and is used for sound power.
- สนามใกล้ (near field)Near field
- บริเวณใกล้แหล่งเสียงมาก ซึ่งความเร็วอนุภาคเปลี่ยนมากในระยะสั้น ๆ Microflown ใช้คุณสมบัตินี้แยกแหล่งเสียงที่อยู่ใกล้กันและสัญญาณแรงขึ้นที่ความถี่ต่ำThe region very close to a source where particle velocity changes strongly over short distances; Microflown uses this to separate closely spaced sources and to gain signal at low frequencies.
Microflown ระบุว่าเซนเซอร์ความเร็วอนุภาคมีรูปแบบการรับเสียง รูปเลขแปด ที่ไม่ขึ้นกับความถี่ จึงหันแกนที่ไวไปยังพื้นผิวที่สนใจและลดเสียงที่มาจากทิศอื่นได้ และเมื่อวัดใกล้ผิวแข็ง เสียงที่ตกกระทบกับเสียงสะท้อนเคลื่อนที่สวนทางกัน ความเร็วอนุภาคของสองส่วนนี้จึงหักล้างกันเป็นส่วนใหญ่ ทำให้ได้รับผลจากเสียงรอบข้างน้อยลง นี่คือเหตุผลที่ Microflown ระบุว่าวิธีนี้ใช้ได้ในสำนักงาน โรงงาน และพื้นที่ที่มีเสียงพื้นหลังMicroflown states that the particle velocity sensor has a frequency-independent figure-of-eight directivity, so its sensitive axis can face the surface of interest while sound from other directions is rejected. Close to a rigid surface, incident and reflected sound travel in opposite directions, so their particle velocities largely cancel and the influence of surrounding sound is reduced. This is why Microflown says the method works in offices, workshops and other places with background noise.
กล้องเสียงเทียบกับ Scan & Paint 2DAcoustic camera vs Scan & Paint 2D
ตารางนี้ใส่เฉพาะข้อมูลที่ผู้ผลิตระบุไว้สำหรับแต่ละระบบ ไม่ได้ตัดสินว่าวิธีใดดีกว่า เพราะคำตอบขึ้นกับโจทย์ ขนาดพื้นที่ ความถี่ของปัญหา และลักษณะของเสียงThis table contains only what each manufacturer states for its system. It does not declare a winner, because the answer depends on the problem, the size of the area, the frequency of the issue and the behaviour of the sound.
| หัวข้อTopic | Sorama CAM iV64 (กล้องเสียง)Sorama CAM iV64 (acoustic camera) | Microflown Scan & Paint 2D |
|---|---|---|
| หลักการPrinciple | Sorama CAM iV64 (กล้องเสียง)Sorama CAM iV64 (acoustic camera)อาร์เรย์ไมโครโฟน MEMS กับ Beamforming (far-field)MEMS microphone array with beamforming (far-field) | Microflown Scan & Paint 2Dหัววัด PU ตัวเดียวสแกนด้วยมือ ร่วมกับกล้องติดตามตำแหน่งA single PU probe scanned by hand, with a position-tracking camera |
| ปริมาณที่วัดQuantities measured | Sorama CAM iV64 (กล้องเสียง)Sorama CAM iV64 (acoustic camera)ความดันเสียงจากไมโครโฟนในอาร์เรย์Sound pressure from the array microphones | Microflown Scan & Paint 2Dความดันเสียงและความเร็วอนุภาคเสียง ณ จุดเดียวกัน คำนวณความเข้มเสียงได้Sound pressure and particle velocity at one point; sound intensity can be calculated |
| ระยะทำงานที่ผู้ผลิตระบุWorking distance stated | Sorama CAM iV64 (กล้องเสียง)Sorama CAM iV64 (acoustic camera)0.3 m ถึง 120 m0.3 m to 120 m | Microflown Scan & Paint 2D1 ถึง 5 cm จากผิวสำหรับหาตำแหน่ง, 5 ถึง 10 cm สำหรับความเข้มเสียง1 to 5 cm from the surface for localization, 5 to 10 cm for intensity |
| ย่านความถี่ที่ผู้ผลิตระบุFrequency range stated | Sorama CAM iV64 (กล้องเสียง)Sorama CAM iV64 (acoustic camera)แผนที่ Beamforming 500 Hz ถึง 27 kHz; สเปกตรัม 29 Hz ถึง 27 kHzBeamforming maps 500 Hz to 27 kHz; spectrum 29 Hz to 27 kHz | Microflown Scan & Paint 2D20 Hz ถึง 14 kHz20 Hz to 14 kHz |
| เวลาที่ได้ภาพWhen the image appears | Sorama CAM iV64 (กล้องเสียง)Sorama CAM iV64 (acoustic camera)แบบเรียลไทม์บนจอของเครื่องIn real time on the device screen | Microflown Scan & Paint 2Dหลังสแกนพื้นที่ที่ต้องการ ติดตามตำแหน่งแบบเรียลไทม์หรือจากวิดีโอ ขึ้นกับรุ่นหัววัดและกล้องAfter scanning the area; tracking is real-time or video-based depending on probe and camera |
| ลักษณะเสียงที่เหมาะSound behaviour suited | Sorama CAM iV64 (กล้องเสียง)Sorama CAM iV64 (acoustic camera)ใช้ดูเสียงขณะเกิดขึ้นจริงในพื้นที่ บันทึกเป็นวิดีโอหรือข้อมูลดิบได้Viewing sound as it happens in an area; can be recorded as video or raw data | Microflown Scan & Paint 2Dสนามเสียงที่คงที่ตามเวลาตลอดการสแกนTime-stationary sound fields throughout the scan |
| ผู้ใช้งานOperation | Sorama CAM iV64 (กล้องเสียง)Sorama CAM iV64 (acoustic camera)ถือและเล็งด้วยมือ หรือใช้ขาตั้งHandheld and aimed, or on a tripod | Microflown Scan & Paint 2Dผู้วัดเลื่อนหัววัดครอบคลุมพื้นผิวที่เข้าถึงได้The operator moves the probe over a reachable surface |
| ผลลัพธ์Output | Sorama CAM iV64 (กล้องเสียง)Sorama CAM iV64 (acoustic camera)ภาพ วิดีโอ ข้อมูล RAW สำหรับ Sorama Portal และรายงานImages, video, RAW data for the Sorama Portal and reports | Microflown Scan & Paint 2Dแผนที่ความดัน ความเร็วอนุภาค หรือความเข้มเสียงบนภาพ สเปกตรัม และการส่งออกข้อมูลตามไลเซนส์Pressure, particle velocity or intensity maps on the image, spectra and data export depending on licence |
ตัวเลขในตารางมาจากเอกสารของผู้ผลิตตามรายการแหล่งข้อมูลท้ายหน้า ผลที่ได้จริงในงานหนึ่ง ๆ ขึ้นกับระยะ สภาพแวดล้อม เสียงพื้นหลัง และการตั้งค่าThe figures in the table come from the manufacturers' documents listed at the end of the page. Actual results on a given job depend on distance, environment, background noise and settings.
งานแบบไหนเหมาะกับวิธีใดWhich approach fits the problem?
- ยังไม่รู้ว่าเสียงมาจากส่วนไหนของพื้นที่หรือเครื่องขนาดใหญ่: เริ่มจากกล้องเสียงเพื่อดูภาพรวมเร็ว ๆ แล้วจึงเลือกบริเวณที่ต้องดูละเอียดYou don't yet know which part of an area or large machine is responsible: start with the acoustic camera for a quick overview, then choose the region that needs detail.
- รู้บริเวณแล้ว ต้องการรายละเอียดบนพื้นผิว เช่น แผ่นครอบ รอยต่อ ขอบประตู หรือท่อทะลุผนัง: การสแกนใกล้ผิวด้วย Scan & Paint 2D ให้แผนที่ละเอียดของบริเวณนั้นYou know the region and need surface detail, such as a cover panel, joint, door edge or pipe penetration: a close scan with Scan & Paint 2D gives a detailed map of that region.
- ปัญหาอยู่ที่ความถี่ต่ำกว่าประมาณ 500 Hz: แผนที่ Beamforming ของ CAM iV64 เริ่มที่ 500 Hz ตามสเปก จึงควรพิจารณาการสแกนใกล้ผิว การวิเคราะห์สเปกตรัม และการทดสอบเปิดปิดร่วมด้วยThe problem is below about 500 Hz: the CAM iV64's beamforming maps start at 500 Hz according to its specification, so consider close scanning, spectrum analysis and on/off tests as well.
- เสียงเกิดเป็นครั้งคราวหรือเปลี่ยนตลอด: ภาพเรียลไทม์และการบันทึกของกล้องเสียงช่วยจับเหตุการณ์ได้ดีกว่า Scan & Paint ต้องการเสียงที่คงที่ระหว่างสแกนThe sound is intermittent or keeps changing: the camera's real-time view and recordings help to catch events; Scan & Paint needs sound that stays steady while scanning.
- พื้นผิวเข้าถึงไม่ได้ อยู่สูง ร้อน หรืออันตราย: การวัดจากระยะห่างด้วยกล้องเสียงเหมาะกว่า เพราะหัววัดต้องอยู่ห่างผิวเพียงไม่กี่เซนติเมตรThe surface is out of reach, high, hot or hazardous: measuring from a distance with the camera is more suitable, since the probe must be within a few centimetres of the surface.
- ต้องการตัวเลขตามมาตรฐาน เช่น ระดับเสียง กำลังเสียง หรือค่าการกันเสียง: ใช้วิธีวัดตามมาตรฐานนั้น ภาพแผนที่ใช้ประกอบการหาจุดแก้ ไม่ใช่ตัวแทนผลตามมาตรฐานYou need a standardised number, such as a sound level, sound power or insulation value: use the method of that standard. Maps support finding what to fix; they do not replace a standardised result.
ใช้สองวิธีร่วมกันอย่างไรHow the two approaches work together
- ภาพรวมเร็ว: วัดที่จุดรับฟังให้รู้ย่านความถี่ที่เป็นปัญหา แล้วใช้กล้องเสียงดูว่าเสียงในย่านนั้นมาจากทิศและบริเวณใดFast overview: measure at the receiver to know the problem band, then use the acoustic camera to see which direction and area the sound in that band comes from.
- กำหนดบริเวณที่สนใจ: เลือกพื้นผิวหรือชิ้นส่วนที่ต้องดูต่อ บันทึกสภาวะการทำงานให้ชัดDefine the region of interest: choose the surface or component to study further and record the operating condition clearly.
- สแกนละเอียดใกล้ผิว: ใช้ Scan & Paint 2D บนบริเวณนั้นในสภาวะเดียวกัน เพื่อดูว่าส่วนใดแผ่เสียงหรือเสียงลอดออกที่ใดDetailed near-field scan: use Scan & Paint 2D on that region in the same condition to see which part radiates or where sound escapes.
- วินิจฉัย: เทียบความถี่กับรอบหมุนหรือกลไก วัดการสั่นถ้าสงสัยเสียงผ่านโครงสร้าง และทดสอบเปิดปิดหรือเปลี่ยนรอบเพื่อยืนยันDiagnosis: match frequencies to rotation or mechanisms, measure vibration if structure-borne sound is suspected, and confirm with on/off or speed-change tests.
- ข้อเสนอแนะการควบคุมเสียง: เลือกมาตรการที่ตรงกับแหล่งหรือทางผ่านที่พบ แล้ววัดซ้ำที่จุดรับฟังในสภาวะเดียวกันเพื่อยืนยันNoise-control recommendation: choose measures that match the source or path found, then measure again at the receiver in the same condition to confirm.
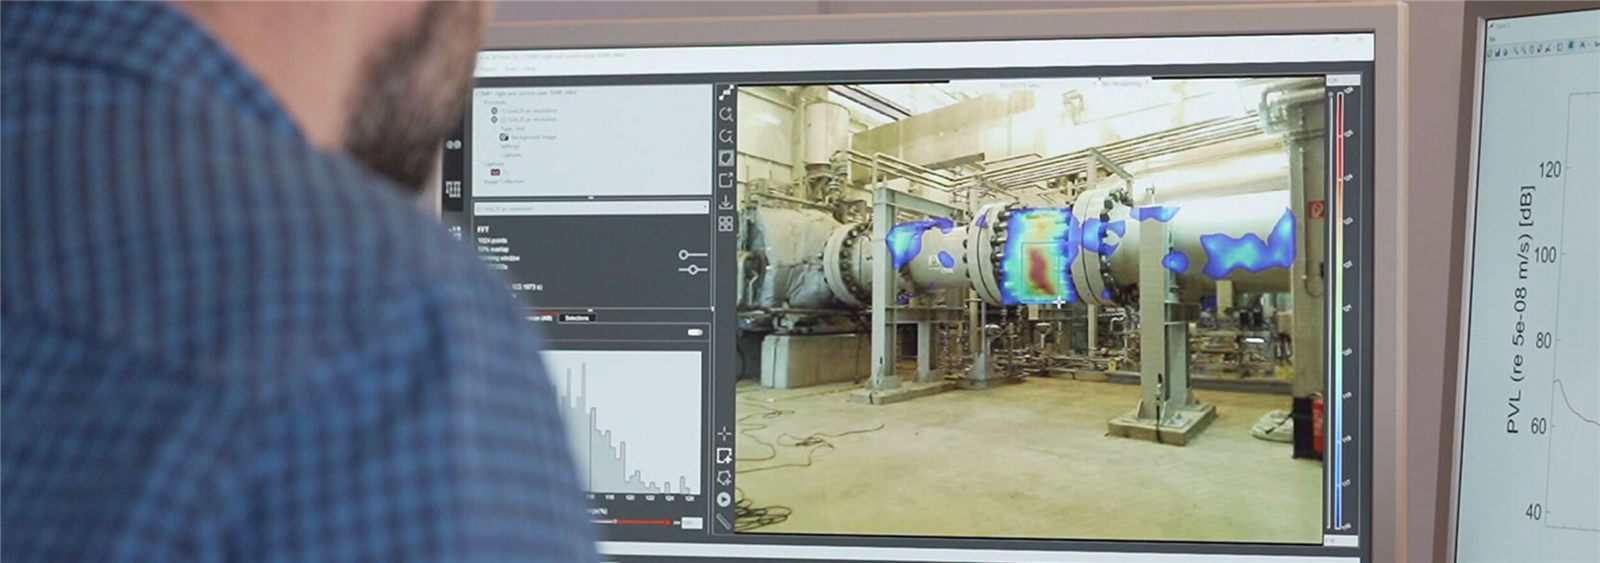
ไม่จำเป็นต้องใช้ทั้งสองวิธีทุกครั้ง หลายงานตอบได้ด้วยกล้องเสียงอย่างเดียว บางงานเหมาะกับการสแกนใกล้ผิวอย่างเดียว และบางงานคำตอบอยู่ที่การวิเคราะห์ความถี่หรือการทดสอบเปิดปิด เราเลือกเครื่องมือตามคำถามของงานBoth approaches are not needed every time. Many jobs are answered with the camera alone, some suit a close scan alone, and for some the answer lies in frequency analysis or on/off tests. We choose the tools to fit the question.
ความถี่สำคัญอย่างไรWhy frequency matters
แผนที่เสียงที่รวมทุกความถี่มักถูกครอบงำด้วยเสียงที่ดังที่สุด ซึ่งอาจไม่ใช่เสียงที่คนร้องเรียน จึงควรวัดที่จุดรับฟังก่อนเพื่อรู้ย่านที่เป็นปัญหา แล้วดูแผนที่เฉพาะย่านนั้น ย่านออกเตฟหรือ 1/3 ออกเตฟบอกว่าพลังงานอยู่ช่วงไหน ส่วน FFT ความละเอียดสูงแยกโทนแคบ ๆ ได้ ซึ่งมักสัมพันธ์กับกลไกของเครื่อง เช่น ความถี่ใบพัด = จำนวนใบ × รอบต่อวินาที ความถี่ขบกันของเฟือง และเสียงหึ่งของหม้อแปลงหรือมอเตอร์ที่สองเท่าของความถี่ไฟฟ้า (100 Hz เมื่อไฟฟ้า 50 Hz)A map of all frequencies together is usually dominated by the loudest sound, which may not be the one people complain about. So measure at the receiver first to know the problem band, then view the map for that band only. Octave or 1/3-octave bands show where the energy is; a high-resolution FFT separates narrow tones, which often relate to the machine's mechanics: the blade-pass frequency = number of blades × revolutions per second, gear-mesh frequencies, and the hum of transformers or motors at twice the mains frequency (100 Hz on a 50 Hz supply).
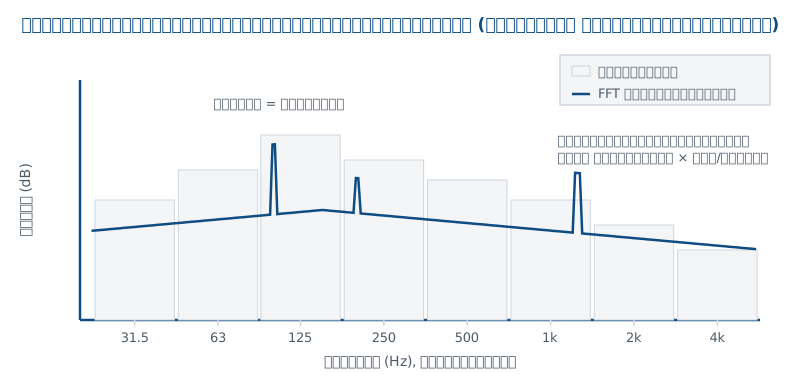
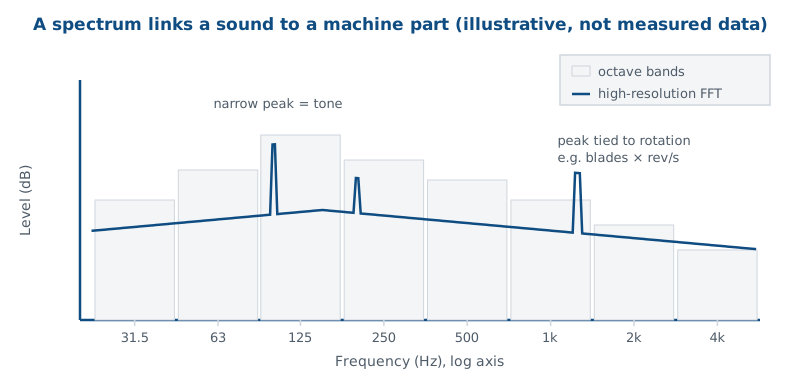
เมื่อยอดในสเปกตรัมที่จุดรับฟังตรงกับความถี่ของชิ้นส่วนใด ก็ชี้ได้ว่าชิ้นส่วนนั้นน่าสงสัย ถ้าเปลี่ยนรอบเครื่องแล้วยอดเลื่อนตาม ยิ่งยืนยันได้ ภาพแผนที่ที่ตั้งย่านไว้ตรงกับยอดนั้นจึงเป็นหลักฐานที่ชัดขึ้นว่าเสียงนั้นออกมาจากตรงไหน นอกจากนี้ควรบันทึก สภาวะการทำงาน ทุกครั้ง เช่น รอบ ภาระ และอุปกรณ์ที่เปิดอยู่ เพราะแหล่งเสียงหลักอาจเปลี่ยนไปตามสภาวะWhen a peak at the receiver matches a component's frequency, that component becomes a suspect; if the peak moves when the machine speed changes, the link is confirmed. A map set to the band of that peak then gives clearer evidence of where the sound comes out. Always record the operating condition as well, such as speed, load and which equipment is running, because the dominant source can change with the condition.
แหล่งกำเนิด ทางผ่าน และผู้รับSource, path and receiver
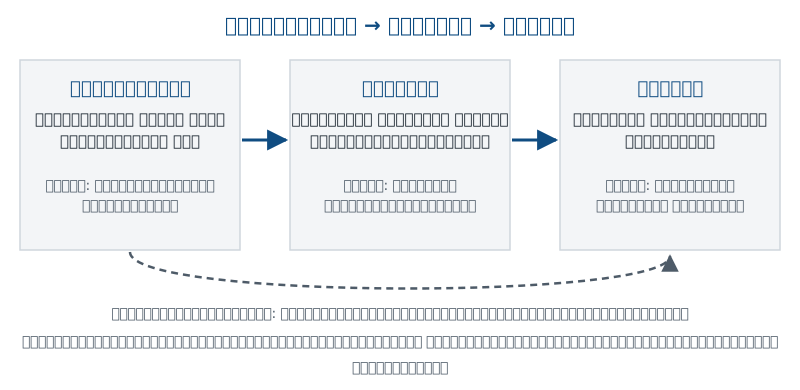
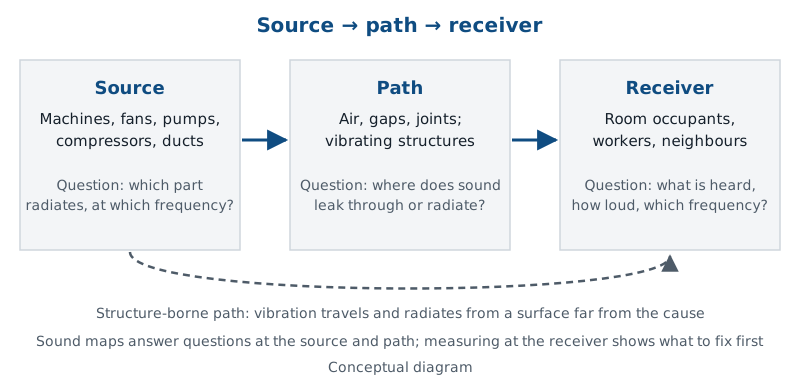
การแก้เสียงทำได้ที่ทั้งสามส่วน ที่แหล่งกำเนิด (ลดรอบ ถ่วงสมดุล เปลี่ยนชิ้นส่วน) ที่ทางผ่าน (ปิดช่องรั่ว เพิ่มมวลหรือความหนา ตัดการส่งผ่านการสั่น) หรือที่ผู้รับ (จัดตำแหน่งใหม่ ปรับห้อง) การรู้ว่าเสียงออกมาจากแหล่งโดยตรง หรือลอดผ่านช่องรั่ว หรือเดินทางผ่านโครงสร้างแล้วแผ่ออกจากพื้นผิวอื่น ทำให้เลือกมาตรการได้ถูกประเภท ภาพที่เห็นจุดสีเข้มบนผนังอาจหมายถึงช่องรั่ว หรือหมายถึงผนังที่ถูกเขย่าด้วยการสั่นจากเครื่องที่ยึดติดอยู่ ซึ่งแก้ต่างกันโดยสิ้นเชิงNoise can be treated at all three: at the source (lower speed, balancing, replacing a part), along the path (sealing leaks, adding mass or thickness, breaking vibration transmission) or at the receiver (relocation, room treatment). Knowing whether the sound comes straight from the source, leaks through a gap, or travels through the structure and radiates from another surface lets you pick the right type of measure. A strong spot on a wall may be a leak, or a wall shaken by a machine fixed to it, and the two are treated completely differently.
วัดก่อนแก้Measure before modifying
การวัดก่อนลงมือแก้ให้สองอย่าง คือรู้ว่าต้องแก้ตรงไหนก่อน และมีข้อมูลตั้งต้นไว้เทียบหลังแก้ ข้อผิดพลาดที่พบบ่อยมีดังนี้Measuring before modifying gives two things: knowing what to fix first, and a baseline to compare against afterwards. Common mistakes are:
- ไม่วัดที่จุดรับฟัง จึงแก้เสียงที่ดังใกล้เครื่อง แต่ไม่ใช่เสียงที่ผู้ร้องเรียนได้ยินNot measuring at the receiver, so fixing what is loud near the machine rather than what the complainant hears.
- ดูแผนที่ที่รวมทุกความถี่ แล้วสรุปจากจุดที่ดังที่สุด ทั้งที่เสียงที่เป็นปัญหาอยู่ในอีกย่านReading a map of all frequencies and concluding from the loudest spot, while the problem sound is in another band.
- เชื่อทิศทางที่หูได้ยินในห้องที่มีเสียงสะท้อนมาก โดยเฉพาะเสียงความถี่ต่ำTrusting the direction heard by ear in a reverberant room, especially at low frequencies.
- วัดใกล้เครื่องจุดเดียวแล้วสรุปว่าส่วนนั้นดังที่สุด ทั้งที่อยู่ในสนามใกล้ของชิ้นส่วนเล็ก ๆMeasuring one point close to a machine and concluding that part is loudest, while standing in the near field of a small component.
- วัดก่อนและหลังแก้ในสภาวะการทำงานต่างกัน จึงเทียบผลไม่ได้Measuring before and after the fix in different operating conditions, so the results cannot be compared.
- คิดว่าปิดแหล่งหนึ่งแล้วระดับลดน้อยแปลว่าแก้ผิดจุด ทั้งที่ยังมีแหล่งอื่นดังพอกันThinking a small drop after switching one source off means the wrong fix, while other similar sources remain.
หาจุดรั่วของเสียงในผนัง ประตู และหน้าต่างFinding sound leaks in walls, doors and windows
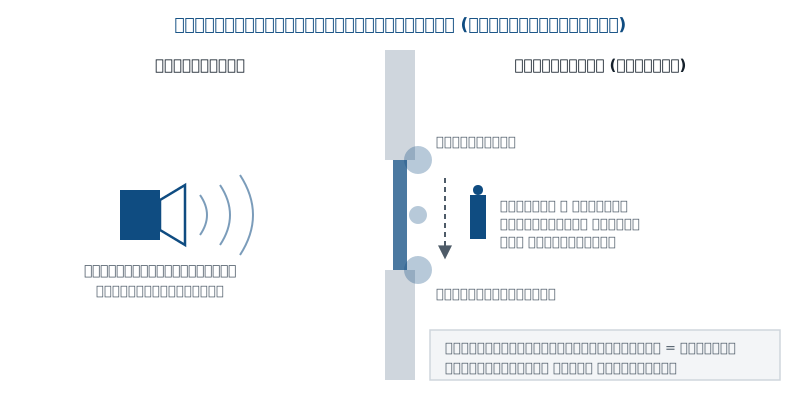
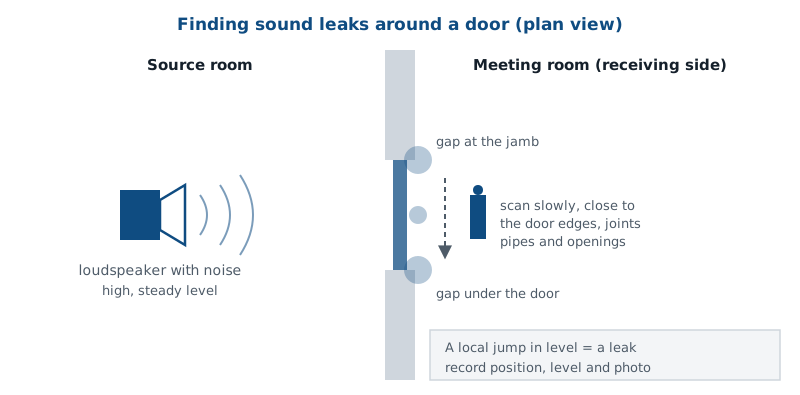
วิธีทั่วไปคือสร้างเสียงระดับสูงและคงที่ในห้องต้นทาง เช่น ลำโพงเปิดเสียงรบกวนแบบกว้างย่าน แล้วตรวจจากฝั่งรับตามขอบประตู กรอบหน้าต่าง รอยต่อผนังกับเพดาน ท่อและสายไฟที่ทะลุผนัง ช่องระบายอากาศ และกล่องปลั๊ก เสียงที่คงที่แบบนี้เหมาะกับทั้งการดูภาพรวมด้วยกล้องเสียง และการสแกนใกล้ผิวด้วย Scan & Paint 2D ถ้าไม่มีเครื่องมือทำภาพ การสแกนด้วยเครื่องวัดระดับเสียงที่ระยะใกล้และคงที่พร้อมฟังผ่านหูฟังก็ช่วยได้มาก จุดที่ระดับสูงขึ้นเฉพาะที่เมื่อเทียบกับผิวผนังรอบ ๆ คือจุดรั่วThe usual approach is to create a high, steady sound in the source room, such as a loudspeaker playing broadband noise, then inspect from the receiving side along door edges, window frames, wall-to-ceiling joints, pipes and cables through the wall, ventilation openings and socket boxes. Such steady sound suits both an overview with the acoustic camera and a close scan with Scan & Paint 2D. Without imaging tools, scanning with a sound level meter at a close, constant distance while listening on headphones still helps a lot. A point that is locally louder than the surrounding wall is a leak.
การหาจุดรั่วบอกว่า “รั่วที่ไหน” แต่ไม่ใช่การวัดค่าการกันเสียงของผนัง ถ้าต้องการตัวเลขการกันเสียงตามมาตรฐาน ให้ใช้วิธีทดสอบในสนามตามคู่มือการทดสอบการกันเสียงผ่านอากาศLeak finding tells you “where it leaks”; it is not a measurement of the wall's sound insulation. For a standardised insulation value, use the field test described in the airborne sound insulation guide.
เครื่องมืออื่นที่ใช้ร่วมกันOther tools used alongside
| เทคนิคTechnique | ได้อะไรGives | ข้อจำกัดLimits |
|---|---|---|
| ฟังและสแกนระดับเสียงListening and level scanning | ได้อะไรGivesระดับทีละจุด ฟังผ่านหูฟัง เร็วและใช้เครื่องมือน้อยLevel at each point, listening on headphones; fast, little equipment | ข้อจำกัดLimitsเสียงพื้นหลังและเสียงสะท้อนหลอกได้Fooled by background and reflections |
| สเปกตรัม FFT / ออกเตฟFFT / octave spectrum | ได้อะไรGivesความถี่เด่นเพื่อจับคู่กับชิ้นส่วนDominant frequencies to match to parts | ข้อจำกัดLimitsไม่บอกตำแหน่งโดยตรงDoes not give position directly |
| ทดสอบเปิดปิดหรือเปลี่ยนรอบOn/off or speed-change tests | ได้อะไรGivesผลของแต่ละแหล่งต่อระดับที่จุดรับฟังEach source's effect on the receiver level | ข้อจำกัดLimitsต้องควบคุมการทำงานของเครื่องได้Requires control over the equipment |
| วัดการสั่นสะเทือนVibration measurement | ได้อะไรGivesยืนยันเสียงผ่านโครงสร้างและกลไกที่เป็นต้นเหตุConfirms structure-borne sound and the mechanism behind it | ข้อจำกัดLimitsต้องติดเซนเซอร์ที่ชิ้นส่วนSensors must be fixed to the parts |
| เซนเซอร์บอกทิศ (เช่น NL1)Direction sensor (e.g. NL1) | ได้อะไรGivesมุมราบและมุมเงยของเสียงเด่นแต่ละย่าน ตามเวลา ที่สถานีเฝ้าระวังAzimuth and elevation of the dominant sound per band over time at a monitoring station | ข้อจำกัดLimitsไม่ใช่ภาพ ไม่บอกระยะNo image, no distance |
NL1 + XL3 (NTi Audio): NL1 ติดใต้ไมโครโฟนของสถานีเฝ้าระวังและต่อกับ XL3 ด้วยสาย USB เส้นเดียว ใช้หลักความเข้มเสียง (ไมโครโฟน 8 ตัว คู่หัววัด 12 คู่) บอกมุมราบและมุมเงยของเสียงเด่นในย่านออกเตฟ 63 Hz ถึง 4 kHz ความแม่นยำทิศ ±10° (ถ่วงน้ำหนัก A) ทุกผลมีตัวชี้วัด ΔPI บอกความน่าเชื่อถือ NL1 ไม่ใช่กล้องเสียง ไม่สร้างภาพแผนที่เสียงและไม่บอกระยะถึงแหล่งเสียง เหมาะกับการเฝ้าระวังระยะยาวเมื่อต้องการรู้ว่าเสียงช่วงเวลาหนึ่งมาจากทิศใดNL1 + XL3 (NTi Audio): the NL1 mounts below a monitoring-station microphone and connects to the XL3 with one USB cable. It works on sound intensity (8 microphones, 12 probe pairs) and reports azimuth and elevation of the dominant sound in octave bands 63 Hz to 4 kHz, with ±10° direction accuracy (A-weighted); every result carries a ΔPI confidence indicator. The NL1 is not an acoustic camera: it makes no sound map and gives no distance to the source. It suits long-term monitoring when you need to know which direction the sound at a given time came from.
งานตรวจอากาศรั่วหรือลมอัดรั่วมักใช้เครื่องตรวจคลื่นอัลตราโซนิก ซึ่งฟังเสียงความถี่สูงเกินการได้ยินจากรอยรั่ว วิธีนี้เก่งกับช่องเล็ก ๆ แต่ไม่ได้บอกว่าช่องนั้นทำให้การกันเสียงความถี่ที่คนได้ยินลดลงเท่าไรAir or compressed-air leak surveys often use ultrasonic detectors, which listen for the above-audible sound of a leak. This finds small gaps well but does not tell how much a gap reduces insulation at audible frequencies.
คำถามที่เราช่วยหาคำตอบได้What we can help you find
- เสียงหึ่งหรือเสียงหวีดที่ได้ยินออกมาจากส่วนใดของเครื่องจักร พัดลม ปั๊ม หรือตัวครอบWhich part of a machine, fan, pump or enclosure the hum or whine you hear comes from.
- เสียงจากห้องข้าง ๆ ลอดผ่านประตู หน้าต่าง รอยต่อ หรือช่องทะลุผนังตรงไหนWhere sound from the next room leaks through a door, window, joint or wall penetration.
- ในหลายแหล่งที่ทำงานพร้อมกัน แหล่งใดสำคัญที่สุดในย่านความถี่ที่เป็นปัญหาWith several sources running together, which one matters most in the problem frequency band.
- เสียงออกจากแหล่งโดยตรง หรือเดินทางผ่านโครงสร้างแล้วแผ่ออกจากพื้นผิวอื่นWhether the sound comes straight from the source or travels through the structure and radiates from another surface.
- มาตรการที่ทำไปแล้วได้ผลที่จุดใด และยังเหลือจุดใดที่ต้องแก้ต่อWhere a measure already taken has worked, and which points still need attention.
GET BEST SOUND ใช้ทั้งกล้องเสียง Sorama CAM iV64 และ Microflown Scan & Paint 2D กับหัววัด PU ในงานบริการ รายละเอียดขอบเขตงานอยู่ที่หน้าบริการระบุตำแหน่งแหล่งเสียงและหาจุดรั่วGET BEST SOUND uses both the Sorama CAM iV64 acoustic camera and Microflown Scan & Paint 2D with a PU probe in its services. The scope of work is described on the sound source localization and leak detection service page.
ตัวอย่างเพื่ออธิบายวิธีการIllustrative example
ห้องปั๊มกับสำนักงานข้างเคียง: ผู้ใช้สำนักงานได้ยินเสียงหึ่งต่อเนื่องจากห้องปั๊มที่อยู่ติดกัน การวัดในสำนักงานพบโทนเด่นชัดในสเปกตรัม จากนั้นใช้กล้องเสียงดูจากฝั่งสำนักงานโดยตั้งย่านความถี่รอบโทนนั้น ภาพชี้ไปที่บริเวณท่อที่ทะลุผนัง จึงสแกนใกล้ผิวรอบช่องทะลุด้วย Scan & Paint 2D ขณะปั๊มทำงานในสภาวะเดิม แผนที่แสดงว่าเสียงออกมาทั้งจากช่องว่างรอบท่อและจากตัวท่อเอง วิศวกรจึงวัดการสั่นของท่อและที่ยึดเพื่อแยกว่าส่วนใดเป็นเสียงผ่านโครงสร้าง ก่อนเสนอให้ปิดช่องรอบท่อและตัดการส่งผ่านการสั่นที่ที่ยึด แล้ววัดซ้ำในสำนักงานในสภาวะเดียวกันเพื่อยืนยันผล
(สถานการณ์สมมุติเพื่ออธิบายวิธีการ ไม่ใช่โครงการจริงของ GET BEST SOUND และไม่ได้แสดงผลลัพธ์ที่คาดหวัง)A pump room and the office next door: office users hear a continuous hum from the adjoining pump room. A measurement in the office shows a distinct tone in the spectrum. The acoustic camera, set to a band around that tone, is then used from the office side, and the image points to the area where a pipe passes through the wall. That area is scanned closely with Scan & Paint 2D while the pump runs in the same condition; the map shows sound coming both from the gap around the pipe and from the pipe itself. The engineer therefore measures the vibration of the pipe and its supports to separate the structure-borne part, before recommending sealing the gap around the pipe and breaking vibration transmission at the supports, then measuring again in the office in the same condition to confirm.
(A hypothetical scenario to explain the method; not a real GET BEST SOUND project and not a statement of expected results.)
สิ่งที่คุณจะได้รับWhat you receive
เนื้อหาของรายงานขึ้นกับขอบเขตงานที่ตกลงกัน โดยทั่วไปประกอบด้วยThe report content depends on the agreed scope; it typically includes:
- ภาพแผนที่เสียงบนภาพถ่ายของจุดที่ตรวจ ในย่านความถี่ที่เกี่ยวข้องกับปัญหาSound maps over photos of the inspected areas, in the frequency bands relevant to the problem.
- สเปกตรัมที่จุดรับฟังและบริเวณแหล่งเสียง พร้อมคำอธิบายย่านที่เป็นปัญหาSpectra at the receiver and near the sources, with an explanation of the problem bands.
- บันทึกสภาวะการทำงาน ตำแหน่ง และเครื่องมือที่ใช้ เพื่อให้วัดซ้ำเทียบกันได้A record of operating conditions, positions and instruments, so the measurement can be repeated and compared.
- การตีความผลและการจัดลำดับจุดที่ควรแก้ก่อน พร้อมข้อจำกัดของการวัดInterpretation and a ranking of what to fix first, with the limitations of the measurement.
- ข้อเสนอแนะแนวทางควบคุมเสียง และการตรวจเพิ่มเติมถ้าจำเป็น เช่น การวัดการสั่นหรือการวัดตามมาตรฐานNoise-control recommendations and further checks where needed, such as vibration measurement or a standardised test.
คำถามที่พบบ่อยFrequently asked questions
กล้องเสียงคืออะไรWhat is an acoustic camera?
อุปกรณ์ที่รวมอาร์เรย์ไมโครโฟนกับกล้องภาพ ซอฟต์แวร์เปรียบเทียบสัญญาณจากไมโครโฟนหลายตัวเพื่อประมาณว่าเสียงมาจากทิศใด แล้วแสดงเป็นแผนที่สีบนภาพ Sorama CAM iV64 ใช้หลัก Beamforming และแสดงผลแบบเรียลไทม์บนจอของเครื่องA device combining a microphone array with a visual camera. Software compares the signals from many microphones to estimate where sound comes from and shows it as a colour map over the image. The Sorama CAM iV64 uses beamforming and shows the result in real time on its screen.
Scan & Paint 2D คืออะไรWhat is Scan & Paint 2D?
ระบบของ Microflown ที่สร้างแผนที่เสียงโดยสแกนหัววัด PU ตัวเดียวด้วยมือใกล้พื้นผิว ขณะที่กล้องติดตามตำแหน่งของหัววัด ซอฟต์แวร์จับคู่ข้อมูลเสียงกับตำแหน่งแล้วแสดงแผนที่ความดัน ความเร็วอนุภาค หรือความเข้มเสียงบนภาพของวัตถุ ใช้กับเสียงที่คงที่ตลอดการสแกนA Microflown system that builds a sound map by scanning a single PU probe by hand close to a surface while a camera tracks the probe. Software links the sound data to positions and shows pressure, particle velocity or intensity maps over the object's image. It is for sound that stays steady during the scan.
หัววัด PU วัดอะไรWhat does a PU probe measure?
วัดความดันเสียงและความเร็วอนุภาคเสียงที่จุดเดียวกัน ความเร็วอนุภาคคือการสั่นไปมาของอนุภาคอากาศเมื่อเสียงผ่าน มีทิศทาง เมื่อมีทั้งสองค่าจึงคำนวณความเข้มเสียงได้Sound pressure and acoustic particle velocity at the same point. Particle velocity is the back-and-forth motion of air particles as sound passes, and it has direction; with both values, sound intensity can be calculated.
วิธีไหนแม่นยำกว่ากันWhich method is more accurate?
ไม่มีคำตอบเดียว กล้องเสียงเหมาะกับการดูภาพรวมจากระยะห่างและเสียงที่เปลี่ยนตามเวลา Scan & Paint 2D ให้รายละเอียดใกล้ผิวของเสียงที่คงที่ ความเหมาะสมขึ้นกับความถี่ ขนาดพื้นที่ การเข้าถึง และลักษณะของเสียงThere is no single answer. The camera suits overviews from a distance and sound that changes over time; Scan & Paint 2D gives near-surface detail of steady sound. Suitability depends on frequency, area size, access and how the sound behaves.
กล้องเสียงบอกสาเหตุของเสียงได้เลยไหมDoes an acoustic camera tell you the cause of the noise?
ไม่ได้โดยอัตโนมัติ ภาพบอกว่าเสียงในย่านที่เลือกออกมาจากบริเวณใด สาเหตุทางกลไกต้องหาต่อด้วยการวิเคราะห์ความถี่ การวัดการสั่น การทดสอบเปิดปิด และความรู้เรื่องเครื่องนั้นNot automatically. The image shows where sound in the selected band comes out; the mechanical cause is found with frequency analysis, vibration measurement, on/off tests and knowledge of the machine.
กล้องเสียงมองทะลุผนังได้ไหมCan an acoustic camera see through walls?
ไม่ได้ ภาพแสดงเสียงที่มาถึงอาร์เรย์จากพื้นผิวและช่องเปิดที่อยู่ในมุมมอง ถ้าเสียงรั่วผ่านผนัง ภาพจะแสดงจุดที่เสียงออกมาทางฝั่งที่กล้องมองอยู่ ไม่ได้แสดงสิ่งที่อยู่หลังผนังNo. The image shows sound reaching the array from the surfaces and openings in view. If sound leaks through a wall, the image shows where it comes out on the side the camera is looking at, not what is behind the wall.
เสียงที่ดังเป็นพัก ๆ ใช้ Scan & Paint 2D ได้ไหมCan Scan & Paint 2D be used for intermittent noise?
Microflown ออกแบบระบบสำหรับสนามเสียงที่คงที่ตามเวลา เสียงที่เกิดเป็นครั้งคราวหรือเปลี่ยนระหว่างสแกนจะทำให้แผนที่ผิดเพี้ยน กรณีนี้การดูแบบเรียลไทม์และบันทึกด้วยกล้องเสียง หรือการทำให้เครื่องทำงานในสภาวะคงที่ระหว่างสแกน มักเหมาะกว่าMicroflown designed the system for time-stationary sound fields; sound that comes and goes or changes during the scan distorts the map. Real-time viewing and recording with the acoustic camera, or running the equipment in a steady condition during the scan, is usually more suitable.
ต้องใช้ทั้งสองวิธีทุกงานไหมAre both methods needed on every job?
ไม่จำเป็น เราเลือกตามคำถามของงาน บางงานใช้กล้องเสียงอย่างเดียว บางงานใช้การสแกนใกล้ผิวอย่างเดียว และบางงานคำตอบอยู่ที่การวิเคราะห์ความถี่หรือการทดสอบเปิดปิดNo. We choose according to the question: some jobs need only the camera, some only a close scan, and for some the answer lies in frequency analysis or on/off tests.
ระหว่างวัดเครื่องจักรต้องทำงานอยู่ไหมMust the equipment be running during the measurement?
ต้องทำงานในสภาวะที่ทำให้เกิดปัญหา เพราะแหล่งเสียงหลักอาจเปลี่ยนตามรอบและภาระ ถ้าควบคุมได้ การเปิดปิดหรือเปลี่ยนรอบทีละเครื่องช่วยยืนยันผลได้มากIt must run in the condition that causes the problem, because the dominant source can change with speed and load. Where possible, switching units on and off or changing speed one at a time helps confirm the result.
NL1 เป็นกล้องเสียงหรือไม่Is the NL1 an acoustic camera?
ไม่ใช่ NL1 ใช้หลักความเข้มเสียงบอกทิศทาง (มุมราบและมุมเงย) ของเสียงเด่นในแต่ละย่านตามเวลา ที่ตำแหน่งที่ติดตั้ง ไม่สร้างภาพแผนที่เสียงและไม่บอกระยะ เหมาะกับการเฝ้าระวังระยะยาว ไม่ใช่การสแกนหาจุดบนเครื่องจักรNo. The NL1 uses sound intensity to give the direction (azimuth and elevation) of the dominant sound per band over time at its location. It makes no sound map and gives no distance; it suits long-term monitoring, not scanning a machine for hotspots.
ปรึกษาปัญหาเสียงกับวิศวกรด้านเสียงDiscuss your noise problem with an acoustic engineer
เล่าให้เราฟังว่าได้ยินเสียงแบบไหน ได้ยินที่ใด ช่วงเวลาใด และมีเครื่องหรือระบบใดที่สงสัย ถ้ามีคลิปเสียงหรือผลวัดเดิมก็ส่งมาได้ วิศวกรของเราจะช่วยประเมินว่าควรเริ่มจากการวัดแบบใด และเครื่องมือใดเหมาะกับโจทย์ ติดต่อ GET BEST SOUND หรือดูรายละเอียดบริการระบุตำแหน่งแหล่งเสียงTell us what the sound is like, where and when it is heard, and which equipment or systems you suspect. Audio clips or earlier measurements are welcome. Our engineers will help you decide which measurement to start with and which tools fit the problem. Contact GET BEST SOUND or see the sound source localization service.