QUICK STARTเริ่มใช้งานใน 5–10 นาทีUp and running in 5–10 minutes
ลองโปรแกรมด้วยข้อมูลตัวอย่างของ NTiTry the program with NTi's demo data
ก่อนวิเคราะห์ข้อมูลจริง ให้ลองกับข้อมูลตัวอย่างที่ NTi แจกมาพร้อมโปรแกรมก่อน ภายในไม่กี่นาทีคุณจะได้เห็นกราฟระดับเสียงระยะยาว ฟังเสียงที่ตรงกับช่วงเวลา ตัดช่วงที่ไม่เกี่ยวข้องออก และเห็นค่าสถิติเปลี่ยนตาม ซึ่งเป็นหัวใจของการใช้ Data ExplorerBefore analysing real data, try the demo data NTi provides with the program. In a few minutes you will see a long-term level chart, listen to the audio for a moment in time, exclude an unrelated period and watch the statistics change, which is the core of working with Data Explorer.
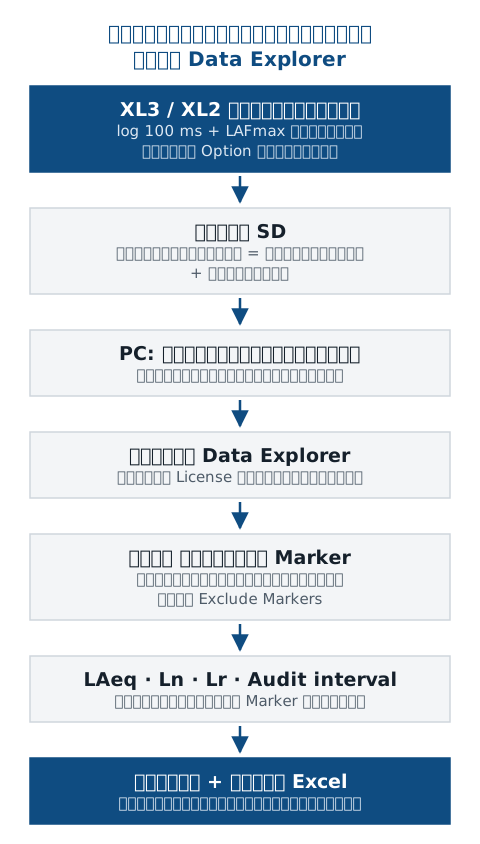
ต้องมีอะไรบ้างก่อนเริ่มWhat you need before you start
- PC ที่ใช้ Windows (NTi ระบุ Windows Vista, 7, 8.x, 10 และ 11) โปรแกรมไม่มีเวอร์ชัน macOSA Windows PC (NTi lists Windows Vista, 7, 8.x, 10 and 11); there is no macOS version
- ไฟล์ Data Explorer จากหน้าผลิตภัณฑ์ของ NTi Audio (ไฟล์ .zip ปัจจุบันคือเวอร์ชัน 2.50 พร้อมข้อมูลตัวอย่าง)The Data Explorer download from NTi Audio's product page (the current .zip is version 2.50, with demo data)
- หูฟังหรือลำโพงคอมพิวเตอร์ สำหรับฟังเสียงที่บันทึกไว้Headphones or PC speakers, to listen to the recorded audio
- STEP1
ดาวน์โหลดและติดตั้งDownload and install
ดาวน์โหลดไฟล์ Data Explorer จากหน้าผลิตภัณฑ์ของ NTi Audio แตกไฟล์ .zip แล้วติดตั้งตามขั้นตอนปกติของ Windows จากนั้นเปิดโปรแกรมDownload Data Explorer from NTi Audio's product page, unzip it, install it the usual Windows way and start the program.
ข้อควรระวังWatch outตัวโปรแกรมใช้ฟรีและติดตั้งได้หลายเครื่อง ติดตั้งทั้งเครื่องสำนักงานและโน้ตบุ๊กหน้างานได้ สิ่งที่ต้องซื้อคือสิทธิ์นำเข้าข้อมูลจากเครื่องวัดของคุณThe program is free and may be installed on several computers, so the office PC and the site laptop can both have it. What you buy is the right to import data from your own instrument.
- STEP2
เปิดข้อมูลตัวอย่างOpen the demo data
เปิดชุดข้อมูลตัวอย่างที่มากับไฟล์ดาวน์โหลด ข้อมูลนี้มีไว้ให้ลองโปรแกรมโดยยังไม่ต้องมี LicenseOpen the demo data set that comes with the download. It is there so you can try the program before you have a licence.
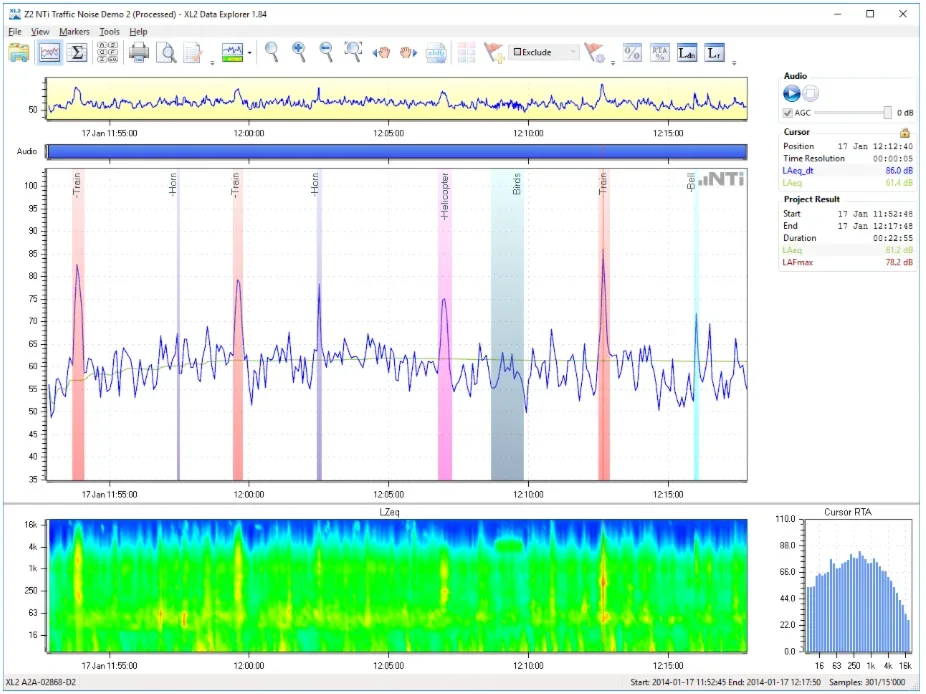
รูปที่ 2Figure 2 ข้อมูลตัวอย่างของ NTi (NTi Traffic Noise Demo 2) เปิดในโปรแกรม — ภาพจากหน้าผลิตภัณฑ์ของ NTi แสดงเวอร์ชันเก่า 1.84 ส่วนไฟล์ดาวน์โหลดปัจจุบันคือ 2.50 หน้าตาจึงอาจต่างเล็กน้อยNTi's demo data (NTi Traffic Noise Demo 2) open in the program. The picture on NTi's product page shows the older version 1.84; the current download is 2.50, so the screen may differ slightly ภาพ: NTi Audio — หน้าผลิตภัณฑ์ Data Explorer (nti-audio.com)Image: NTi Audio — Data Explorer product page (nti-audio.com) - STEP3
ดูกราฟระดับเสียงทั้งช่วงLook at the whole level chart
ในมุมมองกราฟ (chart view) เลือกค่าที่จะแสดงจากเมนูแบบเลื่อนลง เช่น LAeq แล้วซูมและเลื่อนดูทั้งช่วงการวัด สังเกตช่วงที่กราฟพุ่งขึ้นผิดปกติIn the chart view, choose a level to display from the drop-down menu, such as LAeq, then zoom and pan over the whole measurement. Look for periods where the curve jumps up.
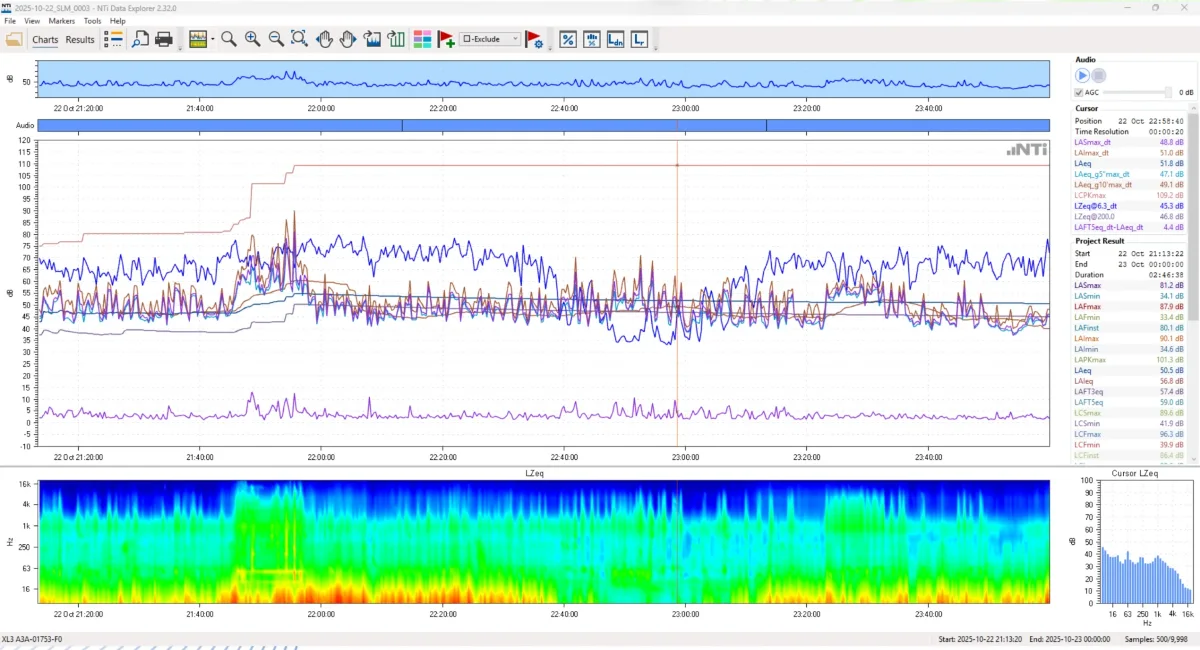
รูปที่ 3Figure 3 หน้าจอหลักของ Data Explorer เวอร์ชัน 2.32.0 (ภาพจากหน้าผลิตภัณฑ์ของ NTi ข้อมูลจาก XL3) — กราฟตรงกลางคือค่าที่บันทึกไว้ตลอดช่วงการวัด ใช้ดูภาพรวมก่อนซูมเข้าไปหาช่วงที่ผิดปกติThe Data Explorer main screen, version 2.32.0 (picture from NTi's product page, XL3 data). The chart in the middle shows the logged values over the whole measurement: get the overview first, then zoom in on unusual periods - กราฟระดับเสียงที่บันทึกไว้ (chart view)The logged levels (chart view)
- เครื่องเล่นเสียง (audio player)The audio player
- spectrogram: ความถี่เทียบเวลาSpectrogram: frequency against time
- สเปกตรัมความถี่ ณ ตำแหน่ง cursorThe frequency spectrum at the cursor
- STEP4
ฟังเสียงตรงช่วงที่สงสัยListen to a suspicious period
เลือกช่วงที่กราฟสูงขึ้นแล้วเล่นเสียงด้วยเครื่องเล่นเสียง (audio player) เสียงจะตรงกับเวลาบนกราฟ ดู spectrogram และสเปกตรัมความถี่ประกอบเพื่อบอกว่าเป็นเสียงอะไรSelect a period where the curve rises and play it in the audio player; the audio is time-aligned with the chart. Use the spectrogram and the frequency spectrum to help tell what the sound is.
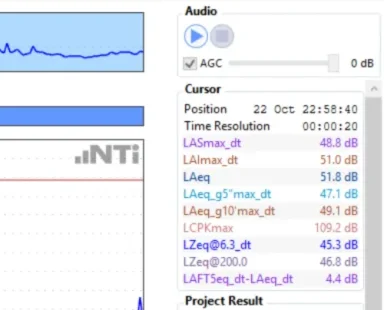
รูปที่ 4Figure 4 ส่วนเล่นเสียงของเวอร์ชัน 2.32.0 (ขยายจากรูปก่อนหน้า) — เสียงเรียงตามเวลาเดียวกับกราฟ ฟังได้ทั้งแบบปรับระดับเองหรือให้โปรแกรมปรับระดับอัตโนมัติThe audio section of version 2.32.0 (enlarged from the previous picture). The audio is aligned with the chart; listen with manual or automatic gain control - ปุ่มเล่นและหยุดเสียงPlay and stop
- AGC: ปรับระดับเสียงอัตโนมัติขณะฟังAGC: automatic gain control while listening
- แถบ Audio: ช่วงเวลาที่มีไฟล์เสียงThe Audio bar: the periods that have audio
- STEP5
ตัดช่วงที่ไม่เกี่ยวข้องออกExclude an unrelated period
ถ้าเสียงนั้นไม่ใช่แหล่งเสียงที่กำลังประเมิน (เช่น คนพูดใกล้ไมโครโฟน) ให้ครอบช่วงนั้นด้วย Exclude Marker แล้วใส่คำอธิบายสั้น ๆIf the sound is not the source you are assessing (e.g. someone talking next to the microphone), cover that period with an Exclude Marker and add a short description.
- STEP6
ดูค่าสถิติเปลี่ยนตามWatch the statistics change
เปิดส่วนสถิติระดับเสียง (level statistics) ดูค่า Percentile เช่น L90 และ L10 เทียบก่อนและหลังตัดช่วงนั้นออก Data Explorer คำนวณใหม่จากข้อมูลที่บันทึกไว้ทุกครั้งที่ Marker เปลี่ยนOpen the level statistics and compare percentiles such as L90 and L10 before and after the exclusion. Data Explorer recalculates them from the logged data whenever the markers change.
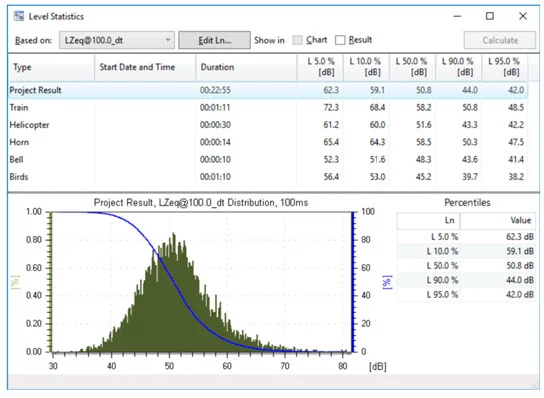
รูปที่ 5Figure 5 หน้าต่าง Level Statistics (ภาพจากหน้าผลิตภัณฑ์ของ NTi ไม่ระบุเวอร์ชัน) — แต่ละแถวคือผลรวมหรือช่วงที่ทำ Marker ค่าจะคำนวณใหม่เมื่อ Marker เปลี่ยนThe Level Statistics window (picture from NTi's product page, version not stated). Each row is the overall result or a marked period; the values are recalculated when the markers change - Based on: ค่าที่ใช้คำนวณ (ระดับรวม หรือย่าน 1/1, 1/3 ออกเตฟ)Based on: the level the statistics use (broadband, or a 1/1 or 1/3-octave band)
- แถวผลรวม (Project Result) และแถวของแต่ละช่วงที่ทำ MarkerThe overall row (Project Result) and one row per marked period
- ตาราง Percentile เช่น L 90.0 % และ L 10.0 %The percentile table, e.g. L 90.0 % and L 10.0 %
- STEP7
ดูหน้าตารายงานPreview the report
เปิดส่วนรายงานการวัด (measurement report) ของโปรแกรม จะเห็นว่าวันที่วัด ข้อมูลการสอบเทียบ และการตั้งค่าเครื่องถูกใส่ให้อัตโนมัติ ส่วนชื่อรายงาน ความเห็น และโลโก้เป็นของคุณOpen the program's measurement report: the measurement date, calibration information and instrument set-up are filled in automatically; the title, comments and logo are yours.
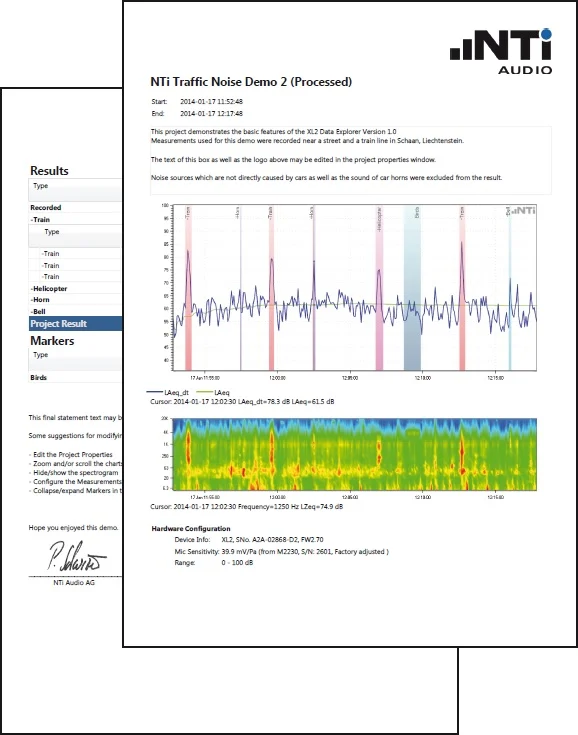
รูปที่ 6Figure 6 ตัวอย่างรายงานจากข้อมูล Demo ของ NTi (ภาพจากหน้าผลิตภัณฑ์ รุ่นเก่าที่ยังใช้ชื่อ XL2 Data Explorer) — รายละเอียดแต่ละส่วนดูในบท ทำรายงานExample report from NTi's demo data (product-page picture of the older XL2 Data Explorer). Each part is explained in the report chapter ภาพ: NTi Audio — หน้าผลิตภัณฑ์ Data Explorer (nti-audio.com)Image: NTi Audio — Data Explorer product page (nti-audio.com)
คุณเห็นวงจรการทำงานครบแล้ว: กราฟ → ฟังเสียง → Marker → สถิติที่คำนวณใหม่ → รายงาน บทต่อจากนี้คือการทำแบบเดียวกันกับข้อมูลจริงของคุณ ซึ่งเรื่องที่สำคัญที่สุดเกิดขึ้นก่อนเปิดโปรแกรม คือเครื่องวัดต้องบันทึกค่าที่จำเป็นและเสียงมาตั้งแต่หน้างานYou have seen the whole loop: chart → listen → marker → recalculated statistics → report. The rest of this guide does the same with your own data, and the most important part happens before you open the program: the instrument must have logged the right values and the audio on site.
ต่อไป: เตรียม License และ Option →Next: prepare the licence and options →
01ติดตั้ง / เปิดโปรแกรมINSTALL / OPEN
ติดตั้งโปรแกรม เตรียม License และ OptionInstall the program, prepare the licence and the options
Data Explorer มีเงื่อนไขสองชั้นที่ต้องเคลียร์ก่อนออกไปวัด ชั้นแรกคือ License ที่ทำให้นำเข้าข้อมูลจากเครื่องของคุณได้ ชั้นที่สองคือ Option บนเครื่องวัดที่ทำให้เครื่องบันทึกข้อมูลที่โปรแกรมต้องใช้ ถ้าขาดชั้นใดชั้นหนึ่ง ปัญหาจะโผล่ตอนที่แก้ไม่ทันแล้วData Explorer has two conditions to settle before you go on site. The first is the licence that lets you import data from your instrument; the second is the option on the instrument that makes it log the data the program needs. Miss either one and the problem appears when it is too late to fix.
License: ผูกกับเครื่องวัด ไม่ใช่กับคอมพิวเตอร์Licence: tied to the instrument, not the computer
| แบบType | สิ่งที่ได้What you get |
|---|---|
| Data Explorer 365Data Explorer 365 | สิ่งที่ได้What you getบริการรายปี นำเข้าข้อมูลจากเครื่องวัดหนึ่งเครื่องได้ตลอด 1 ปี รวมถึงข้อมูลที่บันทึกไว้ก่อนสมัครAnnual subscription: import from one instrument for one year, including data recorded before the subscription |
| Data Explorer 365 CompanyData Explorer 365 Company | สิ่งที่ได้What you getบริการรายปีสำหรับองค์กรที่มีเครื่องวัดตั้งแต่ 3 เครื่องขึ้นไปAnnual subscription for organisations with three or more instruments |
| Data Explorer PermanentData Explorer Permanent | สิ่งที่ได้What you getLicense ถาวรสำหรับเครื่องวัดหนึ่งเครื่องPermanent licence for one instrument |
| XL3 Environmental Noise Bundle (#600 000 741)XL3 Environmental Noise Bundle (#600 000 741) | สิ่งที่ได้What you getรวม XL3 Extended Noise Measurement Option และ License Data Explorer แบบถาวรทั้งคู่XL3 Extended Noise Measurement Option plus a Data Explorer licence, both permanent |
NTi ขาย License ของ XL2 และ XL3 แยกรหัสกัน (XL2: Permanent #600 000 430, 365 #600 000 431 / XL3: Permanent #600 000 717, 365 #600 000 730) และระบุว่าการนำเข้าเปิดใช้ด้วย License ที่เปิดใช้งานสำหรับเครื่องวัดแต่ละเครื่อง ถ้าคุณมีทั้ง XL2 และ XL3 อย่าคิดว่า License ของเครื่องหนึ่งจะใช้กับอีกเครื่องได้NTi sells the XL2 and XL3 licences under separate order numbers (XL2: Permanent #600 000 430, 365 #600 000 431 / XL3: Permanent #600 000 717, 365 #600 000 730) and states that import is enabled by a licence activated for the individual instrument. If you own both an XL2 and an XL3, do not assume one instrument's licence covers the other.
Option บนเครื่องวัด: สิ่งที่โปรแกรมจะได้รับInstrument options: what the program will receive
| เครื่องInstrument | Option ที่ NTi ระบุว่าต้องมีเพื่อใช้งานเต็มรูปแบบOption NTi names for full functionality | ตัวอย่างสิ่งที่ Option เพิ่มให้Examples of what it adds |
|---|---|---|
| XL3XL3 | Option ที่ NTi ระบุว่าต้องมีเพื่อใช้งานเต็มรูปแบบOption NTi names for full functionalityExtended Noise Measurement (Permanent #600 000 707 หรือ 365 #600 000 721)Extended Noise Measurement (Permanent #600 000 707 or 365 #600 000 721) | ตัวอย่างสิ่งที่ Option เพิ่มให้Examples of what it addsLAE, การถ่วงน้ำหนักเวลา Impulse และ LAIeq − LAeq, Percentile (ระดับรวมและสเปกตรัม), การบันทึกทุก 100 ms, บันทึกเสียง 24/32 bit ที่ 12–96 kHz, Level Time History, การบันทึกเมื่อเกิดเหตุการณ์ และ Marker แบบมือและอัตโนมัติLAE, Impulse time weighting and LAIeq − LAeq, percentiles (broadband and spectrum), 100 ms logging, audio at 24/32 bit and 12–96 kHz, level time history, event-triggered recording, manual and automatic markers |
| XL2XL2 | Option ที่ NTi ระบุว่าต้องมีเพื่อใช้งานเต็มรูปแบบOption NTi names for full functionalityXL2 Extended Acoustic PackXL2 Extended Acoustic Pack | ตัวอย่างสิ่งที่ Option เพิ่มให้Examples of what it addsPercentile 0.1–99.9 %, LAE, การบันทึกทุก 100 ms, การบันทึกเมื่อเกิดเหตุการณ์, Impulse และการตรวจความเป็นอิมพัลส์ ส่วนเสียงแบบ WAV เชิงเส้น 24 bit / 48 kHz ประวัติเฟิร์มแวร์ผูกไว้กับ Option นี้ (ถ้าไม่มี XL2 บันทึกเสียงแบบบีบอัด)Percentiles 0.1–99.9 %, LAE, 100 ms logging, event-triggered recording, Impulse and impulsiveness detection; the firmware history ties linear 24-bit / 48 kHz WAV to this option (without it the XL2 records compressed audio) |
ก่อนงานแรก ให้บันทึกการวัดสั้น ๆ สัก 10 นาทีด้วยการตั้งค่าที่จะใช้จริง แล้วลองนำเข้า Data Explorer ถ้านำเข้าได้ มีค่าที่ต้องการครบ และมีเสียง แปลว่าเครื่อง Option และ License เข้าคู่กันแล้วBefore the first job, record a short 10-minute measurement with the settings you will really use and import it into Data Explorer. If it imports, all the values you need are there and the audio plays, the instrument, options and licence match.
ถ้าวัดไว้ก่อนซื้อ License แบบ 365 NTi ระบุว่านำข้อมูลนั้นเข้ามาได้หลังสมัคร จึงไม่ต้องวัดซ้ำIf you measured before buying a 365 licence, NTi states that the data can be imported once the subscription is active, so there is no need to measure again.
วิธีเปิดใช้งาน License (ใส่รหัสในโปรแกรม หรือเปิดใช้บนเครื่องวัด) ไม่ได้อธิบายไว้ในเอกสารสาธารณะของ NTi ถ้าไม่แน่ใจ ให้ตรวจกับผู้ขายก่อนออกไปวัดHow the licence is activated (a key in the program, or on the instrument) is not described in NTi's public documents. If unsure, check with your supplier before the measurement.
02วัดMEASURE
สิ่งที่ต้องให้เครื่องบันทึกมาWhat the instrument must record
Data Explorer ไม่ได้วัดเสียง มันวิเคราะห์เฉพาะสิ่งที่เครื่องวัดบันทึกไว้ ค่าที่ไม่ได้บันทึก หรือเสียงที่ไม่ได้อัดไว้ กู้คืนภายหลังไม่ได้ การวางแผนการตั้งค่าก่อนวัดจึงสำคัญกว่าทุกอย่างที่ทำในโปรแกรมData Explorer does not measure: it analyses only what the instrument logged. Values that were not logged and audio that was not recorded cannot be recovered later, so planning the settings before you measure matters more than anything you do in the program.
| ถ้าต้องการใน Data ExplorerIf you want this in Data Explorer | ต้องให้เครื่องบันทึกThe instrument must record |
|---|---|
| Percentile จาก LAF (เช่น L90 เป็นเสียงพื้นหลัง)LAF-based percentiles (e.g. L90 as background) | ต้องให้เครื่องบันทึกThe instrument must recordช่วงบันทึก (log interval) 100 ms และเพิ่ม LAFmax ในรายการค่าที่บันทึก ตามคำแนะนำของ NTiA 100 ms log interval with LAFmax added to the logged values, as NTi recommends |
| ฟังเสียงเพื่อระบุแหล่งเสียงListening to identify sources | ต้องให้เครื่องบันทึกThe instrument must recordเปิดการบันทึกเสียง (audio recording)Audio recording switched on |
| ประเมิน Tone ด้วย FFTTone assessment by FFT | ต้องให้เครื่องบันทึกThe instrument must recordไฟล์เสียง เพราะโปรแกรมคำนวณ FFT จากเสียงที่บันทึกThe audio file, because the program calculates the FFT from the recording |
| ดูย่านความถี่เทียบเวลา / Percentile รายย่านBands against time / per-band percentiles | ต้องให้เครื่องบันทึกThe instrument must recordสเปกตรัม 1/1 หรือ 1/3 ออกเตฟในรายการค่าที่บันทึกThe 1/1 or 1/3-octave spectrum in the logged values |
| LAeq, Lden และ Rating levelLAeq, Lden and the rating level | ต้องให้เครื่องบันทึกThe instrument must recordLAeq ที่บันทึกต่อเนื่องตลอดช่วงที่ต้องประเมินLAeq logged continuously over the whole assessment period |
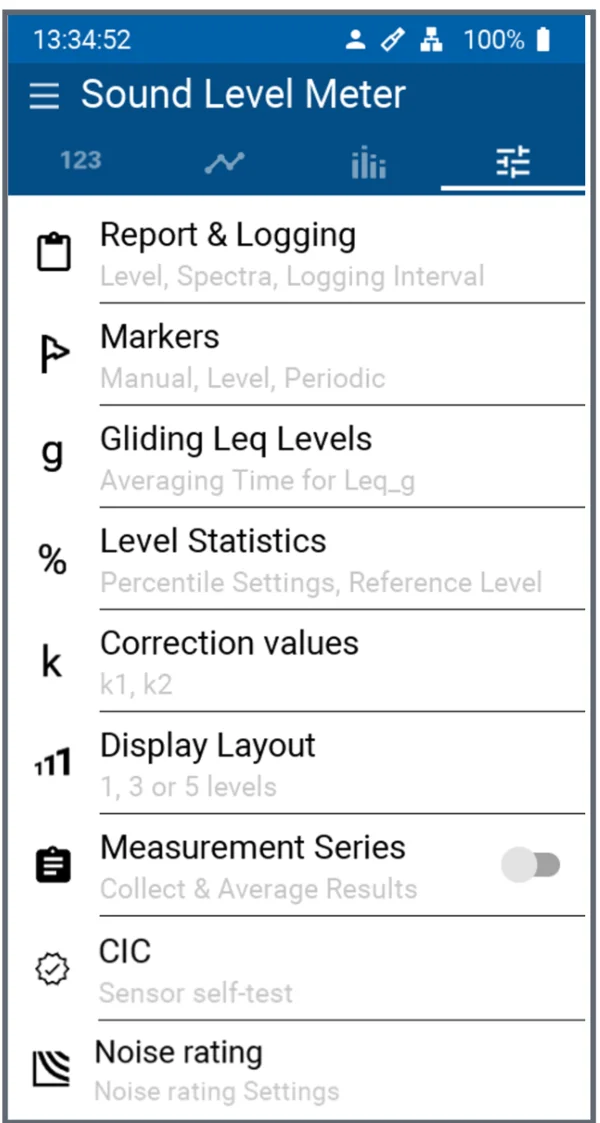
- Report & Logging: ค่าระดับ สเปกตรัม ช่วงบันทึก (Logging Interval 1 s หรือ 100 ms) และการบันทึกเสียงReport & Logging: levels, spectra, the logging interval (1 s or 100 ms) and audio recording
- Markers: Marker แบบ Manual, Level และ Periodic บนเครื่องMarkers: manual, level and periodic markers on the instrument
- Level Statistics: การตั้งค่า Percentile บนเครื่องLevel Statistics: the instrument's percentile settings
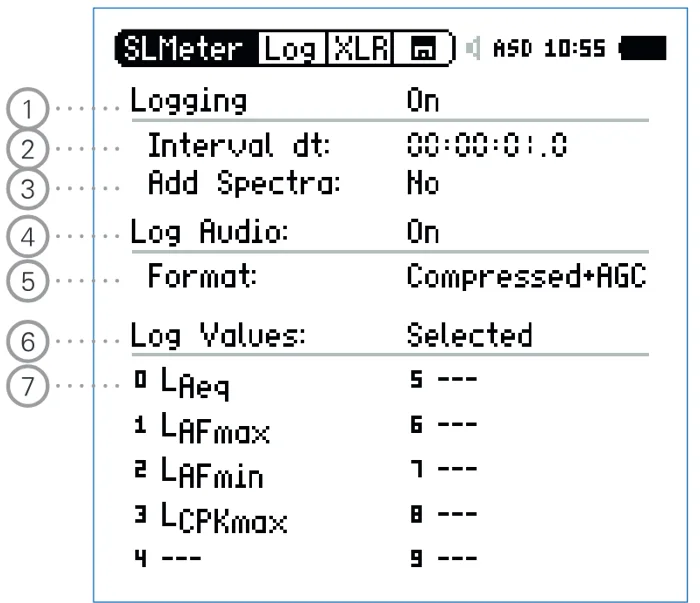
- Logging On: เปิดการบันทึกLogging On: logging switched on
- Interval dt: ช่วงบันทึก (100 ms ต้องมี XL2 Extended Acoustic Pack)Interval dt: the log interval (100 ms needs the XL2 Extended Acoustic Pack)
- Add Spectra: บันทึกสเปกตรัม RTA ทุกช่วงบันทึกAdd Spectra: log the RTA spectrum at every interval
- Log Audio: บันทึกเสียงเป็นไฟล์ WAV (On / Events Only)Log Audio: record audio as WAV (On / Events Only)
- Format: Compressed, Compressed+AGC หรือ 24Bit_48kHzFormat: Compressed, Compressed+AGC or 24Bit_48kHz
- Log Values: All หรือ SelectedLog Values: All or Selected
- รายการค่าที่เลือก (ที่ 100 ms เลือกได้สูงสุด 5 ค่า)The selected values (up to five at 100 ms)
Data Explorer คำนวณ Percentile ใหม่จากค่าที่บันทึกไว้จริง ไม่ได้ใช้สถิติที่เครื่องคำนวณเอง เพราะเหตุนี้โปรแกรมจึงคำนวณใหม่ได้ทุกครั้งที่คุณตัดช่วงด้วย Marker แต่ก็หมายความว่าความละเอียดของผลขึ้นกับช่วงบันทึกที่คุณตั้งData Explorer recalculates percentiles from the values actually logged, not from the instrument's own statistics. That is why it can recalculate every time you exclude a period with a marker, but it also means the result is only as fine as the log interval you set.
- ตรวจระดับด้วย Sound Calibrator ก่อนเริ่มและหลังจบการวัด รายงานของ Data Explorer ดึงข้อมูลการสอบเทียบจากไฟล์ให้เอง แต่ไม่ได้ตรวจแทนคุณCheck the level with a sound calibrator before and after the measurement. The Data Explorer report pulls the calibration information from the file, but it does not do the check for you.
- ตรวจนาฬิกาของเครื่องให้ตรงก่อนเริ่ม เพราะคุณจะเทียบเวลาบนกราฟกับบันทึกเหตุการณ์หน้างานCheck that the instrument clock is right before you start, because you will match times on the chart against your site notes.
- จดเหตุการณ์หน้างานพร้อมเวลา เช่น รถบรรทุกเข้าออก เครื่องจักรเปิด-ปิด ฝนตก คนเดินผ่านWrite down site events with their times: lorries arriving, machines starting and stopping, rain, people walking past.
- วางไมโครโฟนและป้องกันลมตามแนวทางของงานวัดเสียงสิ่งแวดล้อมPosition the microphone and protect it from wind following environmental measurement practice.
ตั้งค่าสถิติบนเครื่องไว้ แล้วคิดว่าจะเปลี่ยนภายหลังได้ ค่าสถิติบนเครื่องต้องเลือกก่อนเริ่มวัดและเปลี่ยนหลังเริ่มแล้วไม่ได้ ส่วนใน Data Explorer คำนวณใหม่ได้ก็ต่อเมื่อค่าที่จำเป็นถูกบันทึกไว้แล้วSetting the statistics on the instrument and assuming they can be changed later. On the instrument they must be chosen before the measurement starts and cannot be changed afterwards; in Data Explorer they can be recalculated only if the necessary values were logged.
ข้อมูลเพิ่มเติมจากประวัติเฟิร์มแวร์ XL3More from the XL3 firmware history
- V1.46: ชื่อเครื่อง (device name) ถูกเขียนลงในไฟล์ logV1.46: the device name is written into the log files
- V1.48: ชื่อการตั้งค่า (configuration name) ถูกเขียนลงในไฟล์ log และ report และเพิ่ม Marker ตามระดับ (level) และตามรอบเวลา (periodic) กับการบันทึกเสียงแบบบีบอัดโดยไม่ใช้ AGCV1.48: the configuration name is written into the log and report files; level and periodic markers and compressed audio without AGC were added
- V1.50: เพิ่ม Marker แบบกดด้วยมือ (manual markers)V1.50: manual markers were added
ถ้าเครื่องของคุณใช้เฟิร์มแวร์เก่ากว่านี้ ให้อัปเดตก่อนงานสำคัญ ส่วนการที่ Marker จากเครื่อง XL3 จะแสดงใน Data Explorer หรือไม่ ยังไม่มีเอกสารของ NTi ยืนยัน ให้จดเวลาเหตุการณ์ไว้เองเสมอIf your instrument runs older firmware, update it before an important job. Whether markers set on the XL3 appear in Data Explorer is not confirmed by an NTi document, so always keep your own timed notes as well.
03โอนข้อมูลTRANSFER
ย้ายข้อมูลจากเครื่องมาที่ PCMove the data from the instrument to the PC
ข้อมูลการวัดหนึ่งครั้งประกอบด้วยไฟล์ข้อความหลายไฟล์และไฟล์เสียง ให้ถือว่าโฟลเดอร์ของการวัดเป็นหนึ่งชุดที่แยกกันไม่ได้One measurement consists of several text files and audio files. Treat the measurement's folder as one set that must not be split up.
| เครื่องInstrument | ข้อมูลเก็บที่ไหนWhere the data is | วิธีย้ายข้อมูลHow to move it |
|---|---|---|
| XL3XL3 | ข้อมูลเก็บที่ไหนWhere the data isไฟล์ TXT แบบเปิดบนการ์ด SD ที่ถอดได้ (32 GB)Open TXT files on a removable SD card (32 GB) | วิธีย้ายข้อมูลHow to move itดาวน์โหลดผ่าน USB-C ซึ่งทำได้แม้การวัดยังดำเนินอยู่ หรือถอดการ์ด SD หรือเข้าถึงไฟล์ผ่านเว็บเซิร์ฟเวอร์และไฟล์เซิร์ฟเวอร์ของเครื่องทาง Wi-Fi/LAN (NTi Connect หรือ IP ของเครื่อง)Download over USB-C, even while a measurement is running; take out the SD card; or reach the files through the instrument's web and file server over Wi-Fi/LAN (NTi Connect or the device IP) |
| XL2XL2 | ข้อมูลเก็บที่ไหนWhere the data isไฟล์รายงานและ log แบบข้อความ และไฟล์เสียง WAV บนการ์ด SD ที่ถอดได้Plain-text report and log files and WAV audio on a removable SD card | วิธีย้ายข้อมูลHow to move itต่อ USB เป็น mass storage หรือถอดการ์ด SDConnect by USB as mass storage, or take out the SD card |
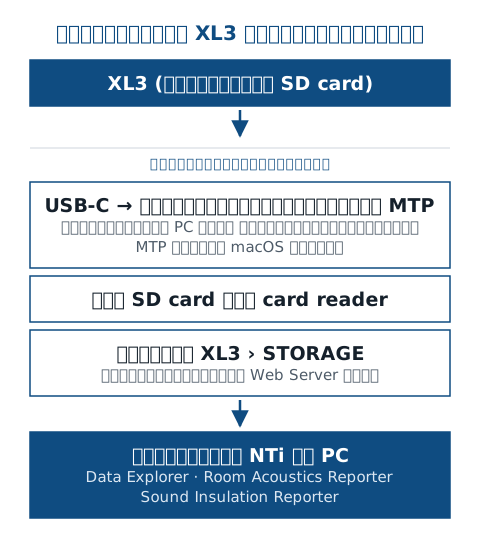
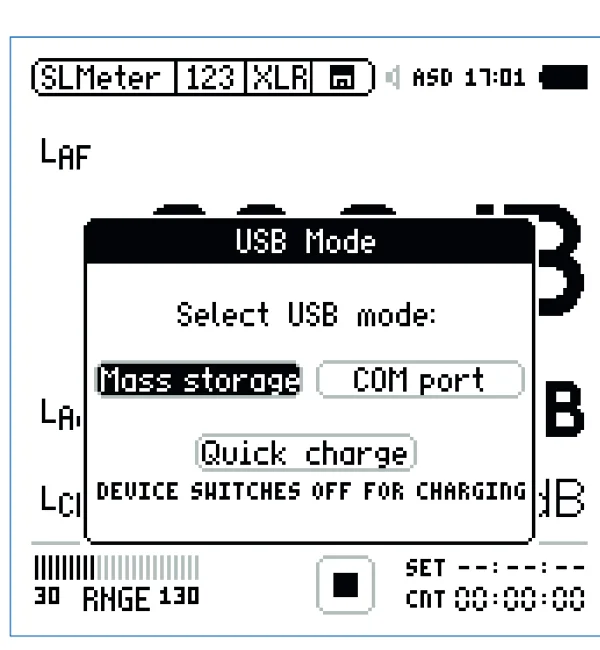
- Mass storage: การ์ด SD ขึ้นเป็นไดรฟ์บน PCMass storage: the SD card appears as a drive on the PC
- คัดลอกโฟลเดอร์ของการวัดทั้งโฟลเดอร์ไปไว้ใน PC อย่าเลือกเฉพาะบางไฟล์Copy the measurement's whole folder to the PC; do not pick individual files.
- ตั้งชื่อโฟลเดอร์ปลายทางให้บอกสถานที่ จุดวัด และวันที่ เช่น โครงการ_จุดวัด1_วันที่Name the destination folder by site, position and date, e.g. project_position1_date.
- เก็บสำเนาข้อมูลดิบไว้แยกหนึ่งชุดที่ไม่แตะต้อง ก่อนเริ่มวิเคราะห์Keep one untouched copy of the raw data before you start analysing.
- เทียบจำนวนไฟล์และขนาดรวมกับบนการ์ด SD ก่อนลบข้อมูลในเครื่องCompare the file count and total size with the SD card before deleting anything on the instrument.
คัดลอกเฉพาะไฟล์ข้อความแล้วลืมไฟล์เสียง ผลคือกราฟขึ้นแต่ฟังเสียงไม่ได้ และประเมิน Tone ด้วย FFT ไม่ได้Copying only the text files and forgetting the audio. The chart appears, but you cannot listen and cannot assess tones by FFT.
ในไฟล์ report และ log ของ XL2 มีชื่อโฟลเดอร์โปรเจกต์และชื่อไฟล์เขียนไว้ด้วย ส่วนโครงสร้างโฟลเดอร์และชื่อไฟล์บนการ์ด SD แบบละเอียดดูได้จากคู่มือ XL2 / XL3 ของ NTiXL2 report and log files include the project folder and file name. For the detailed folder structure and file names on the SD card, see NTi's XL2 / XL3 manuals.
04นำเข้า / โอนข้อมูลIMPORT / TRANSFER
นำเข้าข้อมูลและตรวจความครบถ้วนImport the data and check it is complete
การนำเข้าคือจุดที่ License ถูกใช้ และเป็นจุดแรกที่คุณควรตรวจว่าข้อมูลที่ได้มาครบก่อนลงแรงวิเคราะห์Import is where the licence comes into play, and the first point at which you should check that the data is complete before you put effort into the analysis.
นำเข้าการวัดจากโฟลเดอร์ที่คัดลอกไว้ใน PC ด้วยคำสั่งนำเข้าของโปรแกรม เอกสารสาธารณะของ NTi ไม่ได้ระบุชื่อคำสั่งและไฟล์ที่ต้องเลือก ถ้าไม่แน่ใจให้ดูความช่วยเหลือในตัวโปรแกรม หลักที่ใช้ได้เสมอคือนำเข้าจากสำเนาใน PC ไม่ใช่จากต้นฉบับชุดเดียวที่มีImport the measurement from the folder copied to the PC using the program's import command. NTi's public documents do not name the command or the file to select; if unsure, use the help built into the program. One rule always applies: import from the copy on the PC, not from your only original.
- แถบชื่อหน้าต่าง: ชื่อไฟล์การวัดและเวอร์ชันโปรแกรมTitle bar: measurement file name and program version
- Start, End, Duration ของข้อมูลที่นำเข้า เทียบกับเวลาที่วัดจริงStart, End and Duration of the imported data: compare with the real measurement
- ค่าที่บันทึกไว้ในไฟล์ (เช่น LAFmax, LAeq, ย่านความถี่)The values logged in the file (e.g. LAFmax, LAeq, bands)
- แถบสถานะ: รุ่นและหมายเลขเครื่องที่วัด และช่วงเวลาของข้อมูลStatus bar: model and serial number of the instrument, and the data's time span
- เล่นเสียงเพื่อยืนยันว่ามีไฟล์เสียงครบPlay the audio to confirm it came across
หลังนำเข้า ตรวจสี่อย่าง: เวลาเริ่มและเวลาจบตรงกับที่วัดจริง มีค่าที่ต้องใช้ครบในเมนูเลือกระดับ (เช่น LAeq, LAFmax, สเปกตรัม) เล่นเสียงได้ และไม่มีช่วงข้อมูลขาดที่อธิบายไม่ได้After import, check four things: the start and end times match the real measurement, the drop-down menu offers every value you need (e.g. LAeq, LAFmax, spectrum), the audio plays, and there are no unexplained gaps in the data.
นำเข้าข้อมูลของเครื่องที่ไม่มี License แล้วคิดว่าโปรแกรมเสีย การนำเข้าผูกกับเครื่องวัดแต่ละเครื่อง ข้อมูลจาก XL2 ต้องใช้ License ของ XL2 และข้อมูลจาก XL3 ต้องใช้ License ของ XL3Importing data from an instrument without a licence and thinking the program is broken. Import is tied to each instrument: XL2 data needs an XL2 licence and XL3 data an XL3 licence.
05ตั้งค่าCONFIGURE
เลือกค่าที่แสดงและกำหนดกรอบการประเมินChoose what to display and set the assessment frame
ก่อนเริ่มหาช่วงที่มีปัญหา ให้ตัดสินใจก่อนว่ากำลังประเมินตามเกณฑ์อะไร เพราะเกณฑ์เป็นตัวกำหนดว่าต้องดูค่าไหน ช่วงเวลาไหน และใช้ Penalty แบบใดBefore hunting for problem periods, decide which criteria you are assessing against. The criteria decide which values to look at, which periods, and which penalties apply.
- STEP1
เลือกค่าที่จะแสดงบนกราฟChoose the levels on the chart
ใช้เมนูแบบเลื่อนลงเลือกค่าหนึ่งค่าหรือหลายค่า และแสดงย่าน 1/3 ออกเตฟหนึ่งย่านหรือช่วงของย่านเทียบกับเวลาได้ เริ่มจาก LAeq กับ LAFmax ก่อน แล้วค่อยเพิ่มย่านความถี่เมื่อต้องการดูเสียงเฉพาะความถี่Use the drop-down menu to show one or more levels, and one 1/3-octave band or a range of bands against time. Start with LAeq and LAFmax, then add bands when you need to follow a particular frequency.
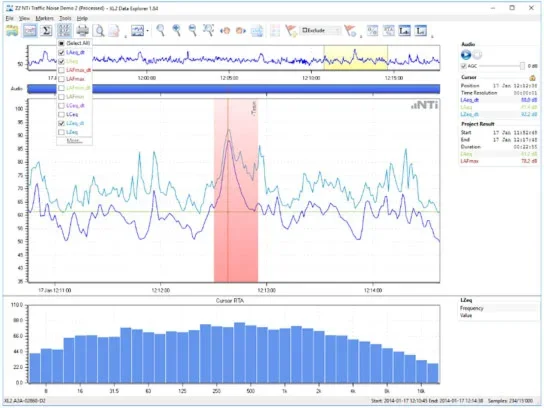
รูปที่ 12Figure 12 เมนูแบบเลื่อนลงสำหรับเลือกค่าที่แสดงบนกราฟ (ภาพจากหน้าผลิตภัณฑ์ของ NTi เวอร์ชัน 1.84) — ติ๊กได้หลายค่าพร้อมกันThe drop-down menu that chooses the levels on the chart (NTi product-page picture, version 1.84): several can be ticked at once - รายการค่าที่บันทึกไว้ ติ๊กเพื่อแสดงบนกราฟThe logged values: tick to show on the chart
- STEP2
เลือกมาตรฐานที่ใช้Choose the standard
Marker อัตโนมัติรองรับเกณฑ์ตาม ISO 1996-2:2017, BS 4142:2014, DM 16 marzo 1998, Arrêté du 23/01/97 และมาตรฐานอื่น ส่วน Rating level พร้อม Penalty อัตโนมัติรองรับ BS 4142, DIN 45645 และ DM 16 marzo 1998 เลือกให้ตรงกับที่ระบุในงานAutomatic markers support criteria per ISO 1996-2:2017, BS 4142:2014, DM 16 marzo 1998, Arrêté du 23/01/97 and other standards; the rating level with automated penalties supports BS 4142, DIN 45645 and DM 16 marzo 1998. Choose the one named for your job.
- STEP3
เลือกช่วง Audit intervalChoose the audit interval
โปรแกรมแบ่งผลเป็นช่วง 1, 2, 5, 10, 15, 30 หรือ 60 นาที เลือกให้ตรงกับช่วงเวลาอ้างอิงของเกณฑ์ที่ใช้ เช่น ถ้าเกณฑ์กำหนดเป็นรายชั่วโมง ก็ใช้ 60 นาทีThe program splits the results into intervals of 1, 2, 5, 10, 15, 30 or 60 minutes. Match the reference period of your criteria: if they are hourly, use 60 minutes.
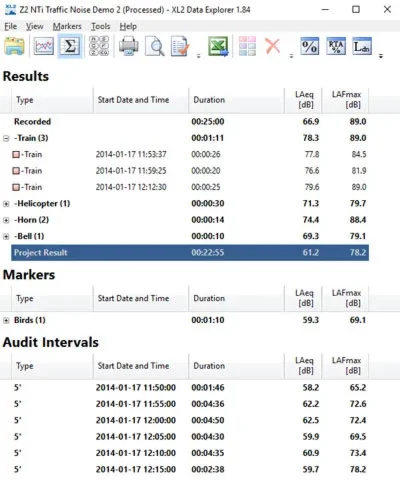
รูปที่ 13Figure 13 ตารางผลของเวอร์ชัน 1.84 (ภาพจากหน้าผลิตภัณฑ์ของ NTi) — ส่วน Audit Intervals ในตัวอย่างนี้แบ่งผลทุก 5 นาทีThe results table in version 1.84 (NTi product-page picture). In this example the Audit Intervals section splits the result every 5 minutes - Audit Intervals: LAeq และ LAFmax ของแต่ละช่วง (5' = 5 นาที)Audit Intervals: LAeq and LAFmax per interval (5' = 5 minutes)
ช่วงเวลากลางวัน กลางคืน และค่าที่บวกเพิ่มในแต่ละช่วงของ Lden/Ldn กำหนดโดยข้อกำหนดที่คุณใช้ประเมิน ไม่ใช่โดยโปรแกรม ตรวจการตั้งค่าในโปรแกรมให้ตรงกับข้อกำหนดก่อนรายงานทุกครั้งThe day, evening and night periods and any added weightings in Lden/Ldn are set by the rules you are assessing against, not by the program. Check the program settings against those rules every time before you report.
ถ้าเกณฑ์ที่ใช้ในประเทศไทยไม่ตรงกับมาตรฐานต่างประเทศที่โปรแกรมมีให้ ให้ใช้โปรแกรมหาช่วงและคำนวณค่าพื้นฐาน (LAeq, Ln ต่อช่วงเวลา) แล้วส่งออกตารางไปประเมินตามสูตรของเกณฑ์นั้นเองIf the criteria you work to do not match one of the foreign standards built into the program, use the program to find periods and calculate the basic values (LAeq, Ln per interval), then export the tables and apply your criteria's own method.
06วิเคราะห์ANALYZE
หาช่วงที่มีปัญหาและทำ MarkerFind the problem periods and set markers
ข้อมูลหลายวันมีเหตุการณ์นับร้อย งานของคุณคือแยกเสียงของแหล่งที่กำลังประเมินออกจากเสียงอื่น ด้วยการดู ฟัง และบันทึกเหตุผลของทุกการตัดสินใจไว้เป็น MarkerSeveral days of data hold hundreds of events. Your job is to separate the source you are assessing from everything else by looking, listening and recording the reason for every decision as a marker.
- STEP1
มองภาพรวมก่อนLook at the overview first
ซูมออกดูทั้งช่วงการวัด หารูปแบบที่ซ้ำ เช่น ระดับที่ขึ้นทุกคืนในเวลาเดียวกัน แล้วค่อยซูมเข้าไปดูรายละเอียดZoom out over the whole measurement and look for repeating patterns, such as a level that rises at the same time every night, then zoom in for detail.
- STEP2
ฟังและดู spectrogramListen and read the spectrogram
เล่นเสียงช่วงที่ระดับสูงขึ้น เสียงเรียงตามเวลาบนกราฟ ดู spectrogram และสเปกตรัมความถี่ประกอบ เสียงที่มีเส้นแนวนอนคงที่ใน spectrogram มักเป็นเสียงที่มี Tone เช่น พัดลมหรือหม้อแปลงPlay the periods where the level rises; the audio is aligned to the chart. Read the spectrogram and frequency spectrum alongside: a steady horizontal line in the spectrogram usually means a tonal sound such as a fan or transformer.
- STEP3
ใส่ Marker พร้อมคำอธิบายAdd markers with descriptions
ครอบช่วงที่สนใจด้วย Marker และเขียนคำอธิบายสั้น ๆ ว่าเป็นอะไร ช่วงที่ทำ Marker ไว้จะคำนวณค่าสถิติแยกได้ และนำไปใส่ในรายงานCover periods of interest with a marker and write a short description of what it is. Marked periods can have their own statistics and go into the report.
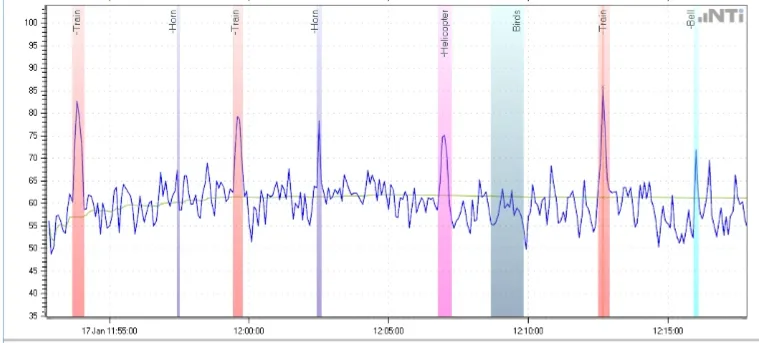
รูปที่ 14Figure 14 ช่วงที่ทำ Marker เป็นแถบสีบนกราฟ พร้อมคำอธิบายที่คุณพิมพ์ เช่น Train, Horn, Helicopter, Birds (ข้อมูล Demo ของ NTi เวอร์ชัน 1.84)Marked periods appear as coloured bands with the description you type, such as Train, Horn, Helicopter, Birds (NTi demo data, version 1.84) ภาพ: NTi Audio — หน้าผลิตภัณฑ์ Data Explorer (nti-audio.com)Image: NTi Audio — Data Explorer product page (nti-audio.com) - STEP4
ตัดเสียงที่ไม่เกี่ยวข้องด้วย Exclude MarkersRemove unrelated sounds with Exclude Markers
เสียงที่ไม่ใช่แหล่งที่ประเมิน เช่น สุนัขเห่าใกล้ไมโครโฟน หรือคนมาแตะขาตั้ง ให้ครอบด้วย Exclude Marker ค่าสถิติจะคำนวณใหม่โดยไม่รวมช่วงนั้นSounds that are not the assessed source, such as a dog barking next to the microphone or someone touching the tripod, get an Exclude Marker; the statistics are recalculated without that period.
- STEP5
ให้โปรแกรมช่วยหาด้วย Marker อัตโนมัติLet automatic markers help
โปรแกรมสร้าง Marker อัตโนมัติจากระดับเสียง Tone Impulse หรือช่วงเวลา ตามมาตรฐานที่เลือก ใช้เป็นตัวช่วยชี้ แล้วฟังยืนยันด้วยตัวเองก่อนสรุปThe program can create automatic markers from levels, tones, impulses or time periods for the chosen standard. Use them as pointers, then confirm by listening before you conclude.
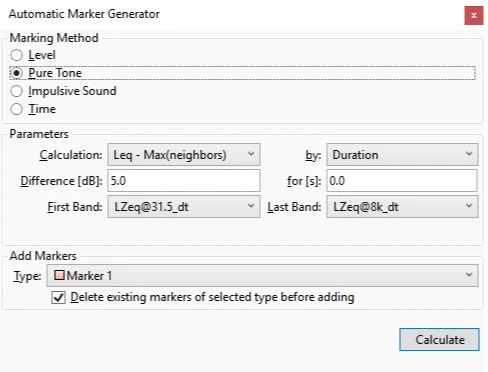
รูปที่ 15Figure 15 หน้าต่างสร้าง Marker อัตโนมัติ (ภาพจากหน้าผลิตภัณฑ์ของ NTi ไม่ระบุเวอร์ชัน) — ผลที่ได้เป็นเพียงตัวชี้ ต้องฟังยืนยันก่อนสรุปThe automatic marker dialog (NTi product-page picture, version not stated). Its results are pointers only: confirm by listening before you conclude - Marking Method: ตามระดับ (Level) Tone (Pure Tone) อิมพัลส์ (Impulsive Sound) หรือช่วงเวลา (Time)Marking Method: by level, tone (Pure Tone), impulse (Impulsive Sound) or time
- Add Markers: ชนิด Marker ที่จะใส่ผลลงไปAdd Markers: the marker type the results are added as
- Calculate สร้าง MarkerCalculate creates the markers
- STEP6
ประเมิน Tone ด้วย FFTAssess tones by FFT
โปรแกรมคำนวณ FFT จากไฟล์เสียงเพื่อประเมิน Tone ตามวิธีทางวิศวกรรมของ ISO 1996-2:2017, DIN 45681 และ BS 4142:2014 ซึ่งต้องมีเสียงที่บันทึกไว้ในช่วงนั้นThe program calculates an FFT from the audio to assess tones using the engineering methods of ISO 1996-2:2017, DIN 45681 and BS 4142:2014; this needs audio recorded for that period.
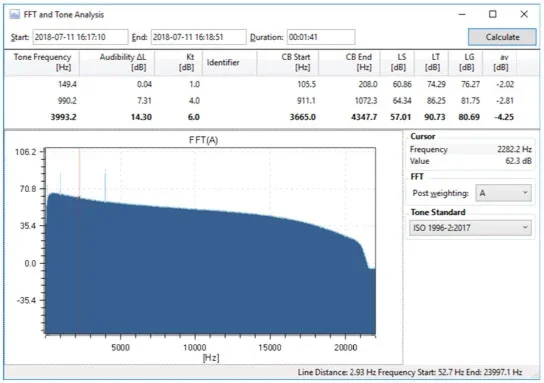
รูปที่ 16Figure 16 หน้าต่าง FFT and Tone Analysis (ภาพจากหน้าผลิตภัณฑ์ของ NTi ไม่ระบุเวอร์ชัน) — คำนวณจากไฟล์เสียงของช่วงที่เลือก จึงต้องมีเสียงบันทึกไว้The FFT and Tone Analysis window (NTi product-page picture, version not stated). It works from the recorded audio of the chosen period, so the audio must exist - ช่วงเวลาที่คำนวณ (Start, End, Duration)The period analysed (Start, End, Duration)
- ตาราง Tone ที่พบ: ความถี่ Audibility ΔL และ KtThe tones found: frequency, audibility ΔL and Kt
- กราฟ FFT ของเสียงช่วงนั้นThe FFT of that period
- Tone Standard: วิธีประเมินตามมาตรฐาน เช่น ISO 1996-2:2017Tone Standard: the assessment method, e.g. ISO 1996-2:2017
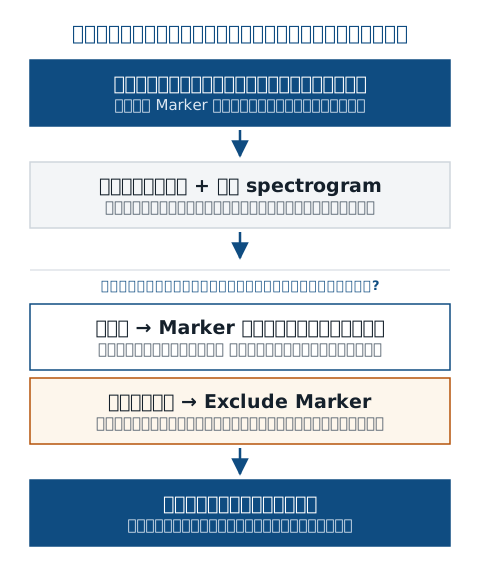
ตัดช่วงออกเมื่อมีเหตุผลทางเทคนิคที่ยืนยันได้จากเสียงหรือบันทึกหน้างาน ไม่ใช่เพราะอยากได้ตัวเลขที่ดูดีขึ้น และเขียนเหตุผลไว้ในคำอธิบายของ Marker ทุกครั้งExclude a period for a technical reason you can confirm from the audio or the site notes, not to get a nicer number, and write that reason into the marker description every time.
เชื่อ Marker อัตโนมัติทั้งหมดโดยไม่ฟัง เสียงนกหรือเสียงเบรกรถอาจถูกจับเป็น Tone หรือ Impulse ได้ การฟังยืนยันคือสิ่งที่ทำให้ผลประเมินป้องกันตัวเองได้เมื่อถูกถามAccepting every automatic marker without listening. Birdsong or a braking vehicle can be picked up as a tone or impulse; confirming by ear is what makes the assessment defensible when questioned.
07อ่านผลINTERPRET RESULTS
อ่านผลให้เป็นRead the results correctly
ตัวเลขแต่ละตัวตอบคำถามคนละข้อ LAeq บอกพลังงานเสียงรวม Percentile บอกว่าเสียงแบบไหนอยู่นานแค่ไหน และ Rating level บอกว่าเสียงนั้นน่ารำคาญแค่ไหนตามเกณฑ์ที่ใช้ อ่านผิดตัวก็สรุปผิดเรื่องEach number answers a different question. LAeq gives the total sound energy, percentiles show how long each kind of sound lasts, and the rating level says how disturbing it is under the criteria used. Read the wrong one and you answer the wrong question.
ระดับเสียงเทียบเท่าแบบถ่วงน้ำหนัก AA-weighted equivalent level LAeq · dB
- คืออะไรWhat it is
- ระดับเสียงเฉลี่ยแบบพลังงานตลอดช่วงเวลาที่เลือกThe energy-average level over the chosen period.
- ทำไมต้องสนใจWhy it matters
- เป็นจุดเริ่มต้นของ Rating level และของเกณฑ์เสียงสิ่งแวดล้อมส่วนใหญ่It is the starting point of the rating level and of most environmental criteria.
- เข้าใจผิดบ่อยCommon misunderstanding
- เหตุการณ์ดังสั้น ๆ ไม่กี่ครั้งดันค่าเฉลี่ยขึ้นได้มาก ดูกราฟประกอบเสมอว่าค่านี้มาจากอะไรA few short loud events can raise it a lot; always check on the chart what the value comes from.
ระดับสูงสุดแบบ FastMaximum level, Fast LAFmax · dB
- คืออะไรWhat it is
- ระดับสูงสุดแบบถ่วงน้ำหนัก A และถ่วงน้ำหนักเวลา Fast ในแต่ละช่วงบันทึกThe highest A-weighted, Fast time-weighted level in each log interval.
- ทำไมต้องสนใจWhy it matters
- บอกเหตุการณ์ดังเป็นครั้งคราว และ NTi แนะนำให้บันทึกค่านี้ทุก 100 ms เพื่อให้ Data Explorer คำนวณ Percentile แบบ LAF ได้It shows occasional loud events, and NTi recommends logging it every 100 ms so Data Explorer can calculate LAF-based percentiles.
- เข้าใจผิดบ่อยCommon misunderstanding
- ค่าสูงสุดแบบถ่วงน้ำหนักเวลาไม่ใช่ค่ายอด (peak)A time-weighted maximum is not the peak level.
ค่า PercentilePercentile levels Ln (L90, L10, L01) · dB
- คืออะไรWhat it is
- ระดับที่ถูกเกินเป็นเวลา n % ของช่วงที่คำนวณ L90 ใช้แทนเสียงพื้นหลัง L01 ใกล้ระดับสูงสุดThe level exceeded for n % of the period. L90 approximates the background; L01 approximates the maximum levels.
- ทำไมต้องสนใจWhy it matters
- ใช้แยกเสียงพื้นหลังที่อยู่ตลอดออกจากเสียงเป็นครั้งคราว และคำนวณใหม่ได้ทั้งการวัด หรือเฉพาะช่วงที่ทำ MarkerSeparates the ever-present background from occasional sound, and can be recalculated for the whole measurement or for marked periods only.
- เข้าใจผิดบ่อยCommon misunderstanding
- ค่าจาก Data Explorer อาจต่างจากค่าบน XL2 เล็กน้อย เพราะโปรแกรมใช้ข้อมูลบันทึกทุก 100 ms ส่วนเครื่องใช้ข้อมูลดิบทุก 1 ms ความต่างเล็กน้อยนี้เป็นเรื่องปกติValues from Data Explorer can differ slightly from those on the XL2, because the program uses 100 ms logged data and the meter its 1 ms raw samples. A small difference is normal.
Rating level Lr · dB
- คืออะไรWhat it is
- ค่าประเมินความรบกวนของเสียงอุตสาหกรรมหรือสิ่งแวดล้อม เริ่มจาก LAeq แล้วบวก Penalty สำหรับ Tone ความเป็นอิมพัลส์ และช่วงเวลาของวันThe assessment value for industrial or environmental noise: it starts from LAeq and adds penalties for tonal and impulsive character and the time of day.
- ทำไมต้องสนใจWhy it matters
- เป็นค่าที่นำไปเทียบกับเกณฑ์ในมาตรฐาน เช่น BS 4142 หรือ DIN 45645It is the value compared with the criteria of standards such as BS 4142 or DIN 45645.
- เข้าใจผิดบ่อยCommon misunderstanding
- Penalty และวิธีคำนวณขึ้นกับมาตรฐานที่เลือก Lr ตามมาตรฐานหนึ่งเทียบกับเกณฑ์ของอีกมาตรฐานไม่ได้ ระบุมาตรฐานในรายงานเสมอThe penalties and the method depend on the standard chosen; an Lr per one standard cannot be compared with another standard's criteria. Always name the standard in the report.
ค่ากลางวัน–กลางคืนDay–night values Lden · Ldn · Lday · Levening · Lnight · dB
- คืออะไรWhat it is
- ค่าเฉลี่ยระยะยาวแยกตามช่วงเวลาของวัน ที่ Data Explorer คำนวณให้Long-term averages per period of the day, calculated by Data Explorer.
- ทำไมต้องสนใจWhy it matters
- ใช้ในเกณฑ์และแผนที่เสียงสิ่งแวดล้อมหลายแบบUsed in many environmental noise criteria and noise maps.
- เข้าใจผิดบ่อยCommon misunderstanding
- ช่วงเวลาและค่าบวกเพิ่มของแต่ละช่วงเป็นไปตามข้อกำหนดที่ใช้ ไม่ใช่ค่าตายตัวThe period times and added weightings follow the applicable rules; they are not fixed values.
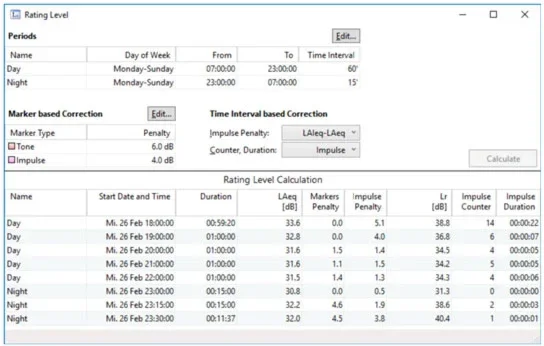
- Periods: ช่วงกลางวัน กลางคืน และช่วงเวลาประเมิน (Time Interval)Periods: day and night periods and their assessment interval (Time Interval)
- Marker based Correction: Penalty ตามชนิด Marker เช่น Tone, ImpulseMarker based Correction: penalties by marker type, e.g. Tone, Impulse
- Time Interval based Correction: Penalty อิมพัลส์ที่คำนวณต่อช่วงTime Interval based Correction: impulse penalty calculated per interval
- ตารางผล: LAeq, Penalty และคอลัมน์ LrThe results: LAeq, penalties and the Lr column
| สิ่งที่เห็นWhat you see | ความหมายที่เป็นไปได้What it may mean |
|---|---|
| LAeq สูงกว่า L10 ชัดเจนLAeq clearly above L10 | ความหมายที่เป็นไปได้What it may meanมีเหตุการณ์ดังสั้น ๆ ไม่กี่ครั้งที่ครอบงำค่าเฉลี่ย ไปฟังช่วงที่ LAFmax สูงที่สุดA few short loud events dominate the average; listen to the periods with the highest LAFmax |
| L90 ใกล้ LAeqL90 close to LAeq | ความหมายที่เป็นไปได้What it may meanเสียงค่อนข้างคงที่ตลอดช่วง เช่น เครื่องจักรที่เดินต่อเนื่องThe sound is fairly steady throughout, e.g. continuously running machinery |
| L90 กลางคืนสูงขึ้นในช่วงเวลาเดิมทุกคืนNight-time L90 rises at the same time every night | ความหมายที่เป็นไปได้What it may meanมีแหล่งเสียงคงที่ที่เปิดตามตารางเวลา ตรวจด้วยการฟังและ spectrogramA steady source switches on to a schedule; confirm by listening and with the spectrogram |
| ค่าสถิติเปลี่ยนมากหลังตัดช่วงเล็ก ๆStatistics change a lot after a small exclusion | ความหมายที่เป็นไปได้What it may meanช่วงที่ตัดมีอิทธิพลมาก ต้องมีเหตุผลที่ชัดเจนและอธิบายในรายงานThe excluded period carries a lot of weight: the reason must be clear and explained in the report |
08รายงานREPORT
ทำรายงานและส่งออกข้อมูลProduce the report and export the data
รายงานที่ดีต้องให้คนอื่นตรวจย้อนได้ว่าตัวเลขมาจากไหน ตัดอะไรออก และเพราะอะไรA good report lets someone else trace where each number came from, what was excluded and why.
- STEP1
ใส่ข้อมูลส่วนหัวของรายงานFill in the report header
ใส่ชื่อรายงาน ความเห็น และโลโก้บริษัท วันที่วัด ข้อมูลการสอบเทียบ และการตั้งค่าเครื่องโปรแกรมใส่ให้อัตโนมัติ ตรวจว่าข้อมูลอัตโนมัติเหล่านี้ถูกต้องAdd the report title, comments and your company logo. The measurement date, calibration information and instrument set-up are added automatically: check that they are correct.
รูปที่ 19Figure 19 ส่วนที่คุณใส่เองกับส่วนที่โปรแกรมใส่ให้ (ภาพจากหน้าผลิตภัณฑ์ของ NTi รุ่นเก่า XL2 Data Explorer)The parts you fill in and the parts the program adds (NTi product-page picture, older XL2 Data Explorer) - ชื่อรายงานและข้อความ: ของคุณTitle and comments: yours
- ตำแหน่งโลโก้: ใส่โลโก้บริษัทของคุณLogo position: add your company logo
- วันเวลาที่วัด: โปรแกรมใส่ให้Measurement date and time: added by the program
- Hardware Configuration: เครื่อง ไมโครโฟน และความไวไมโครโฟน โปรแกรมใส่ให้ ตรวจให้ถูกHardware Configuration: instrument, microphone and its sensitivity, added by the program; check them
- STEP2
ส่งออกตารางไป ExcelExport tables to Excel
ช่วงที่ทำ Marker และผลลัพธ์สุดท้ายอยู่ในตาราง ส่งออกไป Excel ได้ ใช้เมื่อต้องทำกราฟหรือคำนวณตามเกณฑ์ของคุณเองMarked periods and final results are listed in a table that can be exported to Excel, for your own charts or for calculations to your own criteria.
รูปที่ 20Figure 20 ตารางผลที่ส่งออกไป Excel ได้ (เวอร์ชัน 1.84) — มีช่วงที่ทำ Marker ทุกช่วงพร้อมเวลาเริ่มและระยะเวลา และผลสุดท้ายThe results table that exports to Excel (version 1.84): every marked period with its start and duration, plus the final result - Results: ช่วงที่ทำ Marker แยกตามชนิด (เช่น Train 3 ช่วง)Results: marked periods by type (e.g. three Train periods)
- Project Result: ผลสุดท้ายของทั้งโปรเจกต์Project Result: the final result for the project
- Markers: ช่วงที่ทำ Marker อีกกลุ่มหนึ่ง (Birds)Markers: another group of marked periods (Birds)
- STEP3
ส่งช่วงที่ทำ Marker ให้ผู้อื่นตรวจSend marked periods to others
ส่งออกช่วงที่ทำ Marker เป็นโปรเจกต์แยก เพื่อให้ผู้อื่นประเมินต่อได้โดยไม่ต้องส่งข้อมูลทั้งหมดExport marked periods as separate projects so another party can evaluate them without receiving the whole data set.
ก่อนส่งรายงาน: ระบุมาตรฐานที่ใช้ ช่วงเวลาที่ประเมิน ตำแหน่งวัด ผลการตรวจด้วย Sound Calibrator ก่อน-หลัง รายการช่วงที่ตัดออกพร้อมเหตุผล และการตั้งค่าการบันทึก (ช่วงบันทึก ค่าที่บันทึก การบันทึกเสียง)Before sending: the standard used, the assessment periods, the measurement position, the calibrator checks before and after, the list of excluded periods with reasons, and the logging settings (interval, logged values, audio).
รูปแบบไฟล์ของรายงาน (พิมพ์ หรือบันทึกเป็น PDF) ไม่ได้ระบุไว้ในเอกสารสาธารณะของ NTi สิ่งที่ยืนยันได้คือการส่งออกตารางไป Excel ถ้าต้องการ PDF และโปรแกรมไม่มีคำสั่งโดยตรง ให้พิมพ์ผ่านเครื่องพิมพ์ PDF ของ WindowsThe report file format (print, or save as PDF) is not stated in NTi's public documents; what is confirmed is the table export to Excel. If you need a PDF and the program has no direct command, print to a PDF printer in Windows.
09ใช้ร่วมกับเครื่องมืออื่นWORKFLOWS
ตัวอย่าง: บันทึกเสียงสิ่งแวดล้อม 24 ชั่วโมงExample: a 24-hour environmental noise log
ตัวอย่างสมมติเพื่อให้เห็นลำดับงานทั้งหมด ไม่ใช่โครงการจริง ตัวเลขและเกณฑ์ในงานจริงให้ยึดตามข้อกำหนดที่ใช้An illustrative scenario showing the whole sequence, not a real project. In real work, the figures and criteria follow the applicable requirements.
ชุมชนร้องเรียนเสียงหึ่งจากชุดระบายความร้อนของโรงงานข้างเคียงในเวลากลางคืน วิศวกรตั้ง XL3 ที่มี Extended Noise Measurement ไว้ที่ขอบที่ดินของผู้ร้องเรียน 24 ชั่วโมง บันทึก LAeq และ LAFmax ทุก 100 ms สเปกตรัม 1/3 ออกเตฟ และเปิดบันทึกเสียงตลอด ตรวจด้วย Sound Calibrator ก่อนเริ่มและหลังจบ และจดเหตุการณ์ที่เห็นระหว่างติดตั้งและเก็บเครื่องResidents complain about a hum from a neighbouring plant's cooling units at night. The engineer sets up an XL3 with Extended Noise Measurement at the complainant's boundary for 24 hours, logging LAeq and LAFmax every 100 ms, the 1/3-octave spectrum and continuous audio, checks it with a sound calibrator before and after, and notes what happens while installing and collecting the instrument.
- คัดลอกโฟลเดอร์การวัดทั้งชุดผ่าน USB-C มาไว้ใน PC เก็บสำเนาดิบไว้หนึ่งชุด แล้วนำเข้า Data ExplorerCopy the whole measurement folder to the PC over USB-C, keep a raw copy, then import it into Data Explorer.
- ดูกราฟ 24 ชั่วโมง เห็นว่า LAeq ช่วงกลางคืนมีฐานที่สูงขึ้นเป็นช่วง ๆ ในเวลาใกล้เคียงกันทุกชั่วโมงOn the 24-hour chart, the night-time LAeq shows a raised floor in blocks at similar times each hour.
- เพิ่มย่าน 1/3 ออกเตฟบนกราฟและดู spectrogram พบเส้นแนวนอนที่ความถี่ต่ำชัดเจนในช่วงเดียวกัน ฟังเสียงแล้วยืนยันว่าเป็นเสียงหึ่งของเครื่องจักรAdding 1/3-octave bands and reading the spectrogram shows a clear low-frequency horizontal line in the same blocks; listening confirms the machinery hum.
- ใส่ Marker ช่วงที่เครื่องทำงานพร้อมคำอธิบาย และใช้ Exclude Markers ตัดรถจักรยานยนต์ที่วิ่งผ่านและสุนัขเห่า หลังฟังยืนยันแล้วMark the operating periods with a description, and use Exclude Markers for passing motorcycles and barking dogs after confirming them by ear.
- ให้โปรแกรมประเมิน Tone ด้วย FFT จากเสียงที่บันทึก ตามมาตรฐานที่ตกลงใช้ในงานLet the program assess the tone by FFT from the recorded audio, per the standard agreed for the job.
- ตั้ง Audit interval ให้ตรงกับช่วงอ้างอิงของเกณฑ์ เทียบ LAeq ช่วงเครื่องทำงานกับ L90 ช่วงที่เครื่องหยุด เพื่อแยกเสียงของแหล่งออกจากเสียงพื้นหลังSet the audit interval to the criteria's reference period and compare the LAeq with the plant running against the L90 with it stopped, to separate the source from the background.
- คำนวณ Rating level ตามมาตรฐานที่ใช้ (ถ้าเป็นมาตรฐานที่โปรแกรมรองรับ) หรือส่งออกตารางไป Excel เพื่อประเมินตามเกณฑ์ของงาน แล้วทำรายงานพร้อมรายการช่วงที่ตัดออกและเหตุผลCalculate the rating level per the standard used (if the program supports it), or export the tables to Excel to assess against the job's criteria, then produce the report with the list of excluded periods and reasons.
ถ้าไม่ได้บันทึกเสียงไว้ ขั้นที่ 3–5 ทำไม่ได้เลย คุณจะมีแค่กราฟที่บอกว่าดัง แต่พิสูจน์ไม่ได้ว่าเสียงมาจากโรงงานWithout the audio, steps 3–5 are impossible: you would have a chart that shows it is loud, but no proof that the sound comes from the plant.
10แก้ปัญหาTROUBLESHOOT
ปัญหาที่พบบ่อยและวิธีแก้Common problems and fixes
| อาการSymptom | สาเหตุที่เป็นไปได้Likely cause | วิธีแก้Fix |
|---|---|---|
| นำเข้าไม่ได้ หรือขึ้นเรื่อง LicenseImport refused or a licence message | สาเหตุที่เป็นไปได้Likely causeไม่มี License สำหรับเครื่องนั้น หรือใช้ License ของอีกรุ่น (XL2/XL3)No licence for that instrument, or the licence belongs to the other model (XL2/XL3) | วิธีแก้Fixตรวจว่า License ตรงกับหมายเลขเครื่องและรุ่น ติดต่อผู้ขายถ้ายังไม่แน่ใจCheck the licence matches the instrument's serial number and model; contact your supplier if unsure |
| ไม่มีค่า Percentile ให้เลือก หรือคำนวณไม่ได้No percentiles available | สาเหตุที่เป็นไปได้Likely causeเครื่องไม่มี Extended Noise Measurement (XL3) / XL2 Extended Acoustic Pack หรือไม่ได้บันทึกค่าที่ต้องใช้No Extended Noise Measurement (XL3) / XL2 Extended Acoustic Pack, or the needed values were not logged | วิธีแก้Fixเพิ่ม Option และตั้ง log 100 ms พร้อม LAFmax สำหรับการวัดครั้งต่อไปAdd the option and log at 100 ms with LAFmax for the next measurement |
| ฟังเสียงไม่ได้ / ประเมิน Tone ไม่ได้No audio / no tone assessment | สาเหตุที่เป็นไปได้Likely causeไม่ได้เปิดบันทึกเสียง หรือคัดลอกไฟล์เสียงมาไม่ครบAudio recording was off, or the audio files were not copied | วิธีแก้Fixตรวจการ์ด SD และคัดลอกทั้งโฟลเดอร์ใหม่ ครั้งต่อไปเปิดบันทึกเสียงCheck the SD card and copy the whole folder again; switch audio on next time |
| Ln ไม่ตรงกับค่าบนเครื่อง XL2Ln differs from the XL2 display | สาเหตุที่เป็นไปได้Likely causeโปรแกรมใช้ข้อมูล 100 ms ส่วนเครื่องใช้ข้อมูลดิบ 1 msThe program uses 100 ms data, the meter 1 ms raw samples | วิธีแก้Fixความต่างเล็กน้อยเป็นเรื่องปกติ ระบุในรายงานว่าใช้ค่าจากแหล่งใดA small difference is normal; state in the report which source the values come from |
| เวลาบนกราฟไม่ตรงกับบันทึกหน้างานChart times do not match the site notes | สาเหตุที่เป็นไปได้Likely causeนาฬิกาเครื่องไม่ตรงThe instrument clock was wrong | วิธีแก้Fixบันทึกค่าต่างของเวลาไว้ในรายงาน และตั้งนาฬิกาก่อนวัดครั้งต่อไปRecord the offset in the report and set the clock before the next measurement |
| ติดตั้งบน Mac ไม่ได้Cannot install on a Mac | สาเหตุที่เป็นไปได้Likely causeNTi ระบุเฉพาะ WindowsNTi lists Windows only | วิธีแก้Fixใช้ PC WindowsUse a Windows PC |